
Sélectionnez votre langue préférée
Les changements de langue seront appliqués immédiatement
Sélectionnez votre langue préférée
Les changements de langue seront appliqués immédiatement
Basics of Japanese Candlesticks
"Understand the fundamentals of Japanese candlesticks and compelling price movement reading. Learn bearish and bullish patterns to implement in your trading."
Équipe Wikilix
Équipe de Contenu Éducatif
Picture 18th-century Japan—you walk into a rice market and feel the heightened emotions from all traders. A rice merchant had a great idea: instead of just a price, why not use visual bars to reflect buying and selling pressure? That was the beginning of candlestick charts! The merchant saw price fluctuations reflect the emotions of traders. Fast forward to today: candlesticks are intuitive, easy-to-read visual representations of market information that provide a statistical analysis process.
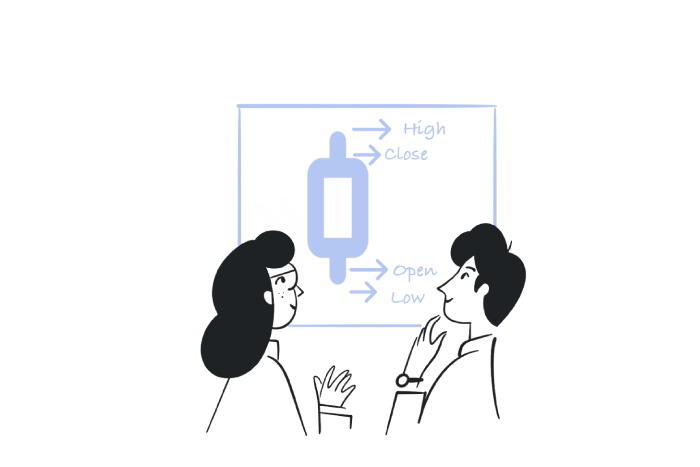
Though a candlestick may look simple, it shows four critical data points: the opening price, closing price, high price, and low price of the trading period. The body of the candlestick (block) shows price changes from the opening price to the closing price. Wicks or shadows are longer, thinner lines that extend upward and beyond the body of the candle, showing highs and lows. In a bullish candle (often hollow or green), the close will be higher than the open. In a bearish candle (usually filled with the color red), the close is lower than the open price.
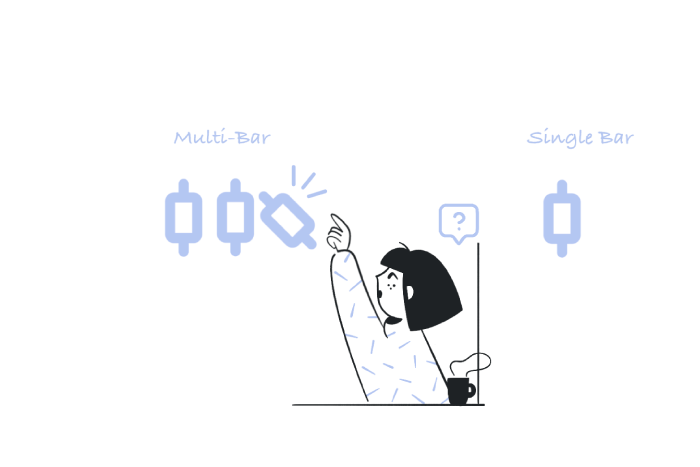
When seeking an immediate grasp of market sentiment, candlesticks surpass all other indicators for clarity. Line charts only use closing prices to connect dots, leaving the emotions over the period of candles (bars) out of the picture. Candlesticks capture the battle between buyers and sellers in each period with greater clarity and a snapshot, allowing you to gather intuitive market sentiment and patterns with additional helpful data.
These candles have a thin body and long shadows – this suggests indecision, both buyers and sellers had a say, but neither prevailed. When spinning tops appear after a trend, they can often indicate a possible pause or reversal.
Unambiguously solid, strong candles, with no wicks, either full white (bullish) or entirely black/red (bearish), communicate conviction. They indicate that the trend will continue.
Doji candles, with the opening and closing nearly identical, express neutrality. They yell, "The market cannot decide. When they appear following heavy trends, they can indicate the possibilities for a turning point in direction.
A small candle, followed by a larger candle that engulfs the previous candle's body. Bullish engulfing after a downtrend can indicate an upward reversal; bearish engulfing after a rise may indicate that sellers are taking charge.
The pattern means "pregnant," in Japanese, and signifies a small candle that is nested entirely within the previous large candle. The pattern indicates a slowdown of previous momentum, which may suggest a turning point ahead.
These are sequences of three bars. A Morning Star (usually treated as bullish) follows a downtrend: A big bearish bar, followed by a small-bodied bar, and then a big bullish bar. The Evening Star is the flawless inverse of a Morning Star and indicates a potential bearish reversal.• Three Methods (Gathering and Releasing)
Consider these candles as a brief pause in the middle of a strong trend. A long candle, followed by candles moving sideways, and then another long candle in the same direction - this pause indicates the market gathering its strength before continuing its direction.
Candlestick Patterns have their language - Hammers, Shooting Stars, Dragonfly Doji, Gravestone Doji, Three White Soldiers, Three Black Crows. Not to mention, they all have their nuances. Regardless, they can all be interpreted as visual cues for likely continuation or reversal patterns, and it's always beneficial to notice them when they occur around important trend lines or levels.
Candlesticks are powerful, but bring some friends. Like trend lines, support/resistance zones, moving averages, or indicators such as RSI. If you notice a bullish engulf at a known support level, it becomes more valid. If you notice a Doji during thin volume, it becomes less credible. Notice the key here is follow-through and context.
• Scalpers & Day Traders, generally speaking, will look at 5 to 15minutes – you are focusing on quick, repetitive setups.
• Swing traders will focus on 4-hour or daily candles - catching the good signals while ignoring the noise.
• Long-term investors would look at either weekly or monthly bars - smoothing volatility and looking for more considerable trends.
Don't develop "pattern blindness" - seeing patterns everywhere. Being mindful, while understanding candlestick patterns are not assurances, they are probabilities. Always remember to be aware of the trend and don't over-trade. Also, always remember that the more often you see the pattern, the more cautious you should be.
From its origins in rice trading to its dominating position in modern-day global markets, Japanese Candlestick Charts are an elegant, timeless technique for visualizing investor sentiment and identifying market opportunity. Whether it is the acceptance of a Doji, or the hopefulness of a Morning Star shining in revealing the actual value of the security, and if you're prepared to recognize it, the candle is the means of telling its story.
Consider utilizing candlestick pattern analysis and information with other tools, apply understandings to your level of trading timeframe, and use candlestick patterns for guidance on what decisions to make, but never to dictate; learn the basics, remain disciplined, and these patterns will provide you rich insights into the heart beat of the market with simple yet elegant shapes.
Continuez à développer vos connaissances avec notre parcours d'apprentissage structuré. Chaque section s'appuie sur la précédente.
C'est la première section
Vous êtes au début de votre parcours!
C'est la dernière section
Vous avez terminé ce cours!
12 min
Temps de lecture
Débutant
Difficulté
