
Sélectionnez votre langue préférée
Les changements de langue seront appliqués immédiatement
Sélectionnez votre langue préférée
Les changements de langue seront appliqués immédiatement
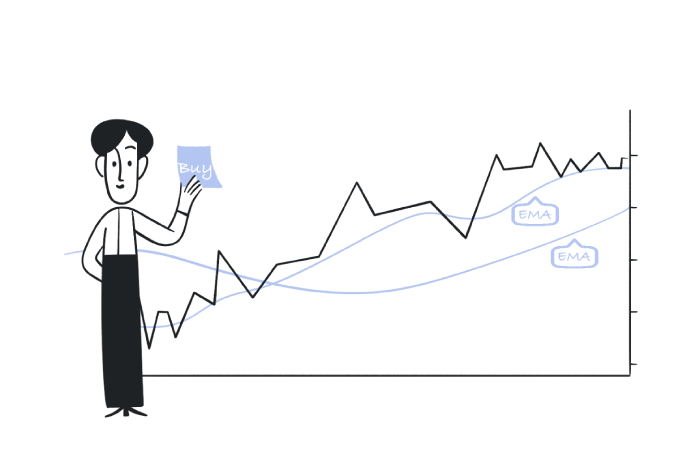
Exponential Moving Average (EMA)
"Master the Exponential Moving Average (EMA) and discover how traders utilize it to track trends, recognize reversals, and develop various trading strategies across numerous markets. "
Équipe Wikilix
Équipe de Contenu Éducatif
Have you ever wondered how traders seem to predict the market's direction before it moves? The truth is, nobody can ever predict prices to an exact degree, but some tools can help make trends more apparent and predictable. One of the most common and powerful tools in original technical analysis is the Exponential Moving Average (EMA).
The EMA differs from simple moving averages because it reacts to price changes more quickly; thus, it is preferred for use in fast-moving markets by traders looking to act soon. Whether you are new to trading or simply refining your strategies, knowing how EMA works can change how you read charts and make better decisions.
The Exponential Moving Average is a technical indicator that provides the average price of an asset over a specified number of periods, with more recent prices given greater weight than less recent ones.
This makes the EMA more reactive about current market conditions compared to the SMA, which is one reason traders prefer the EMA in marketplaces requiring quick responses, such as forex, stocks, and cryptocurrencies.
The calculation is more intricate than SMA, but the idea is the same:
1. To begin, use the SMA for your first EMA value 2. Use a smoothing multiplier, which is defined as follows:
Multiplier = 2 / ( N + 1)
Where N is the number of periods.
3. Use the formula:
EMA = [Current Price × Multiplier] + [Previous EMA × ( 1 − Multiplier)]
As EMA gives more weight to recent prices, it also reacts much faster to changes in price direction than SMA.
Traders like EMA for several reasons.
• Faster signals: reacts quickly to price changes, which is a good thing for day traders and scalpers looking for quick trades.
• Clarity with trends: smooths out useless noise and identifies the true price trend.
• Versatility: works with various markets, not just forex, but stocks, crypto, and commodities too.
• Momentum indicator: especially useful for indicating early reversal or continuation signals.
The EMA lengths will tend to vary with your trading style and whether an asset trades dependently on the time of day:
• Short-term EMA (9, 12, 20 periods): ideal for day traders or scalpers who are making quick trades.
• Medium-term EMA (26, 50 periods): generally used by swing traders who are looking to capitalise on mid-term price moves.
• Long-term EMA (100, 200 periods): useful for investors and position traders looking to capture long-term trends.
Many traders like to use different EMAs at the same time, as this will provide a much clearer picture of market direction and momentum.
One of the more popular ways that EMAs are traded, is through crossover:
• Bullish Crossover (Golden Cross): When a short-term EMA (20-day) crosses above a long-term EMA (50-day), this can often be the start of an upward price trend.
• Bearish Crossover (Death Cross): When a short-term EMA crosses a long-term EMA, this signifies downward momentum.
Crossovers help traders pinpoint precise entry and exit points while keeping it simple.
EMAs can also serve as dynamic support and resistance on a chart:
• In an uptrend, a price will often pull back to or towards the EMA before bouncing back higher.
• In a downtrend, the EMA can frequently serve as a ceiling that the price cannot break through.
This price action can be utilized with trading to pinpoint precise entry points and to set stop losses just beyond the EMA.

While EMA can effectively be used on its own, combining EMA with other indicators will help with accuracy:
• MACD (Moving Average Convergence Divergence): based on EMAs and assesses both trend strength and momentum.
• Relative Strength Indicator (RSI): confirms if an asset is in an overbought or oversold condition.
• Volume Indicators: the ensures that a price move facilitated using EMA has enough volume to support the activity.
• Support and resistance levels: will help pinpoint when the EMA has been tested at certain levels.
Using multiple tools to filter out false signals will help to increase high-probability set-ups.
While both are similar and are often used as moving averages, each serves a different purpose.
Feature | EMA | SMA |
Weighting | More weight on recent prices | Equal weight to all periods |
Speed | Reacts faster to changes | Responds more slowly |
Ideal Use | Short-term trading | Long-term analysis |
Signal Quality | Better in volatile markets | Smoother, less noisy |
If you are looking for faster signals, the EMA is a better option. However, many traders use both together for confirmation.
New Traders are often prone to misusing the EMA, which generally means they lose money! Don't make the following mistakes:
• Too many EMAs. An overwhelming use of EMAs in line with a chart, which leads to chart clutter. Limit yourself to 2-3 EMAs.
• Forget about the nature of the market. EMA works best in trending conditions, and can give some false signals in a sideways market condition.
• Blindly follow crossovers. Always confirm your EMA signals with the price action or some other indicators.
• Period mismatch for the time frame. Keep the period for the EMA consistent with your trading style.
Now that you can avoid EMA mistakes, you should be able to use EMA properly as part of your trading plan.
EMA is not a specific asset class: it is used in various markets:
• Forex: Identifying upward and downward trending reversals that are highly volatile.
• Stocks: Identifying breakout levels and managing entries and exits during earnings season.
• Crypto: Identifying directional price action characterizing a rapidly changing asset price movement.
• Commodities: Identifying directional moves in products such as gold, oil, and agricultural products.
EMA is universal because of its versatility, irrespective of skill level.
Let's say you are trading a popular cryptocurrency that has been showing a continuous trend upwards for some time, and you catch the trend. By plotting your 20-day EMA, you can see through the price action that the price has bounced off of this EMA several times.
On the subsequent pullback, the price touches the EMA and then forms a bullish reversal candle and continues with its upward ascent. Now, you enter this trade because you can see you are in an upward trend. You also made a point of not only entering the trade but also having your stop-loss set just below the EMA, so if you are wrong, you are only risking a small amount of money to get a proper trade stop loss.
The exponential moving average (EMA) is one of the most valuable and flexible indicators in technical analysis. Its fast reaction time to price changes allows traders to act quickly and easily identify opportunities in fast-moving, trend-driven markets.
Nevertheless, the EMA needs to be deployed correctly—consider the EMA periods, use EMA with other indicators, and be aware of the market conditions to which you apply it.
As a beginning trader or a more experienced trader, you can provide yourself with an obvious opportunity to perform trend analysis, potential reversals, and make better trading decisions by learning how to use the EMA.
Continuez à développer vos connaissances avec notre parcours d'apprentissage structuré. Chaque section s'appuie sur la précédente.
C'est la première section
Vous êtes au début de votre parcours!
C'est la dernière section
Vous avez terminé ce cours!
14 min
Temps de lecture
Débutant
Difficulté
