
Beginner
Using Fibonacci in Forex Analysis
Using Fibonacci in Forex Analysis
"Curious how Fibonacci tools can improve your forex trading? Learn how to use Fibonacci retracement and extension levels to identify key entry and exit points with precision.""
Wikilix Team
Educational Content Team
July 30, 2025
12 min
Reading time
Beginner
Difficulty
#learningwave#UsingFibonacciinForexAnalysis#forex

Why do prices tend to turn at what look like random points on a chart? Or why pullbacks tend to stall or bounce at just the "right" levels? It's not magic—it's mathematics. Or more precisely, the Fibonacci sequence. As much as it may appear to be complex or reserved for math whizzes, Fibonacci levels have emerged as one of the forex industry's most popular trading tools for a reason: they allow traders to predict where the market will turn. Whether you wish to add a mighty layer of accuracy and insight to your technical analysis, conquering Fibonacci retracement is the secret. Now, let's move on to how you can utilize Fibonacci tools to your advantage to improve your forex strategy.
What Is the Fibonacci Sequence?
The Fibonacci sequence is a series of numbers where each number is the sum of the two preceding numbers:
0, 1, 1, 2, 3, 5, 8, 13, 21, 34, and so forth.
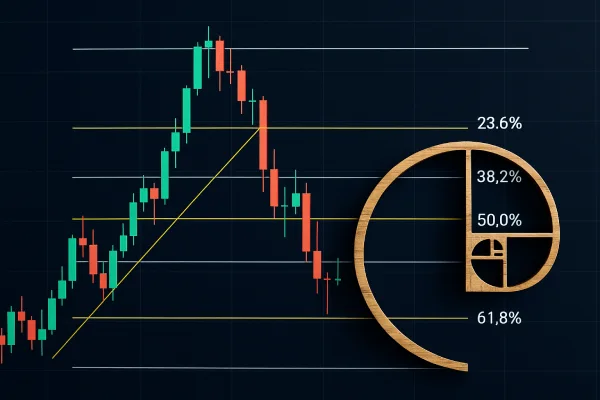
More meaningfully to traders, the ratios that are derived from this series—such as 23.6%, 38.2%, 50%, 61.8%, and 78.6%—are purported to capture natural points of reversal in financial markets. These are the levels used in technical analysis to identify probable areas of support and resistance.
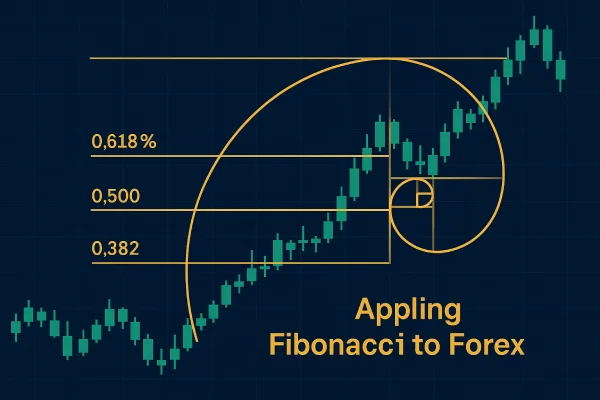
The most consequential of these ratios is 61.8%, also referred to as the "Golden Ratio." It appears in various forms, from market demand to architecture—and yes, on trading charts.
What Is Fibonacci Retracement Forex?
Fibonacci retracement is a trading tool that helps predict how far the price will move back before resuming its original direction. Prices within a trend never move in a straight line. Instead, they swing in waves—go up then retreat.
Using the Fibonacci retracement tool, traders can identify primary levels where the price is likely to pause or reverse.
For example:
tIn an uptrend, they plot the Fibonacci retracement from the swing high to the swing low.
tIn a downtrend, it is from the swing low to the swing high.
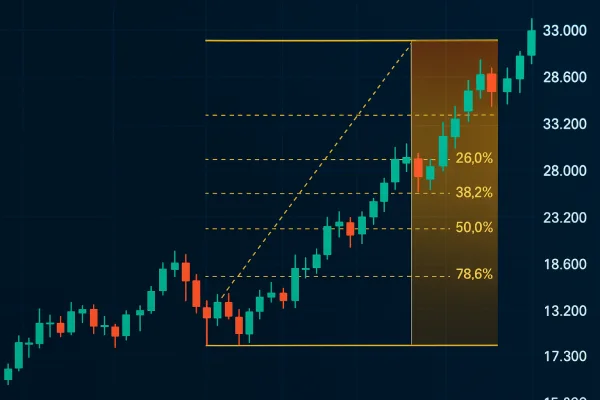
The indicator plots horizontal lines at the significant Fibonacci levels (23.6%, 38.2%, 50%, 61.8%, and sometimes 78.6%), providing traders with visual markers to identify price reactions.
Why Use Fibonacci in Forex Trading?
There are several reasons why Fibonacci analysis has such broad applications in forex:
tIt Works on All Timeframes
Whether day trading or swing trading, Fibonacci levels apply to any chart.
tIt Synergizes with Other Indicators
Fibonacci levels complement trendlines, moving averages, candlestick formations, and other indicators.
tThey Are Natural Market Psychology
These levels serve as self-fulfilling prophecies, as many traders rely on them, leading to a collective response at these levels.
It Aids Entry, Exit, and Stop-Loss Placement
Knowing where prices can turn helps with risk management and trade planning more logically.
Key Fibonacci Levels Explained
The following is what each level represents in use:
• 23.6% – A shallow correction. Shows strong momentum within the trend.
• 38.2% – Often the first significant area of interest in a pullback.
• 50% – Not a Fibonacci proportion, but often used. Suggests a balanced correction.
• 61.8% – The "golden" retracement level. Typically marks strong reversal points.
• 78.6% – Very deep retracement, but not invalidating the trend at this stage.
Applying Fibonacci to Your Forex Strategy
Step-by-step, let's do this:
✅ 1. Identify the Trend
Use basic price action or indicators, such as moving averages, to determine whether the market is trending up or trending down.
✅ 2. Mark the Swing High and Low
For an uptrend:
Select the lowest of the trend (swing low)
Drag onto the highest (swing high)
For a downtrend:
Select the swing high
Drag onto the swing low
Your Fibonacci levels should appear on your chart.
✅ 3. Look for Confluence
Don't use Fibonacci alone. Check if the retracement levels overlap with:
Past zones of support/resistance
Moving averages (such as 50 EMA)
Trendlines
Price patterns (such as bullish engulfing, pin bars)
This convergence reinforces the level.
✅ 4. Plan Your Trade
When you notice a confluence:
tEnter at or around the Fibonacci level
tPlace your stop-loss below/above the level
tTake your target at the next significant level (e.g., old high/low or another Fibonacci extension)
Fibonacci Extensions: Targeting Profits
Fibonacci tools are applied not only to retracements—they also help in projecting take profit points with Fibonacci extensions.
Common extension levels are:
t127.2%
t161.8%
t261.8%
For example, in an uptrend:
1. Find the impulse wave (move up)
2. Expect the retracement
3. Use extensions to continue the next leg up
This helps traders set realistic price objectives above their highs.
Example: Fibonacci in Action
EUR/USD is in an uptrend.
• Price rallies from 1.0800 to 1.1200 (impulse move)
• It then retraces to 1.1000
• Using the Fibonacci retracement tool, we have:
38.2% level = 1.1050
50% level = 1.1000
61.8% level = 1.0950
Price rebounds right back to the 50% level and starts rising again. Using the Fibonacci extension tool, we target:
127.2% = 1.1300
161.8% = 1.1350
The pair subsequently reaches 1.1320, close to the 127.2% Fibonacci level—where traders typically take profit.
How to Use Fibonacci Effectively
✅ Always wait for confirmation — do not trade based on Fibonacci level alone.
✅ Use it with structure — use it alongside price action or indicators.
✅ Longer timeframes are stronger than shorter ones.
✅ Keep it simple — don't clutter your chart with too much information.
Mistakes to Avoid
❌ Drawing Fib incorrectly – Always draw low to high in uptrends, high to low in downtrends.
❌ Using Fibonacci in isolation – It's not a magic bullet; it works best along with other tools.
❌ Disrespecting the trend – Don't expect retracement levels to hold if you're trading against a strong trend.❌ Making inroads at levels with no thinking – Always look for candlestick confirmation or confluence from other indicators.
Conclusion
Fibonacci is not another flashy technical device—it's an old method with mathematical and market psychology roots. Appropriately used, Fibonacci retracements and extensions can give you a sense of where the market may shift direction, slow down, or accelerate.
The key is to use it in context, with confirmation, and in conjunction with other tools. Whether you're planning entries, setting stops, or mapping out profit targets, Fibonacci helps add structure and logic to your decisions.
So next time the market pulls back, don't panic—plot your levels, look for the confluence, and trust the math that's been guiding traders for centuries.insert your content
Continue Learning
What's Next?
Keep building your knowledge with our structured learning path. Each section builds upon the previous one.
This is the first section
You're at the beginning of your journey!
This is the last section
You've completed this course!