
Beginner
Basic Patterns that Every Trader Should Identify
Basic Patterns that Every Trader Should Identify
"Want to trade with more confidence? Learn the basic chart patterns—like head and shoulders, triangles, and double tops—that every trader should recognize to spot high-probability setups"
Wikilix Team
Educational Content Team
July 30, 2025
15 min
Reading time
Beginner
Difficulty
#learningwave#KeyChartPatternsEveryTraderShouldKnow#forex

Have you ever looked at a price chart and wondered if you were missing something obvious? Like there was a secret rhythm or a recognizable signal that was just beyond your grasp? The reality is that most successful traders don't decode the markets with formulas. They see patterns — shapes and movements that are often repeated rhythmically. Patterns are the market's way of giving you clues. Once you know how to identify a pattern, the decisions you make as a trader will feel less like a guess and more like an informed decision. This page will outline some of the primary chart patterns that every trader should be familiar with, explain the meanings represented by these patterns, and provide guidance on how to utilize them for optimal opportunities.
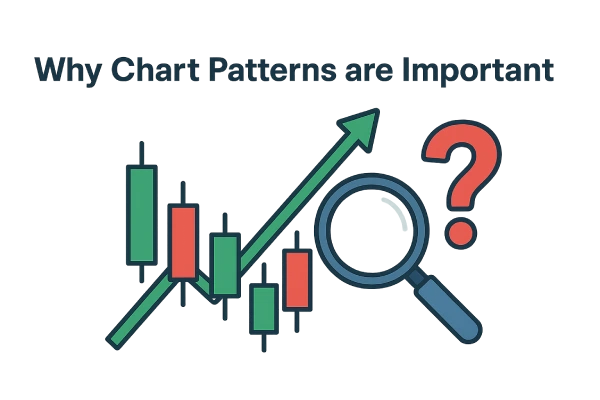
Why Chart Patterns are Important
Trading isn't just about numbers; it's about behavior. People influence the markets: their fear, their greed, their indecision, or overconfidence. All of these emotions can contribute to price movements. Chart patterns help traders cut through the noise to identify opportunities just below the surface.
By learning to understand chart patterns, you can help yourself to:
- Execute trades with better timing
- Recognize possible reversals or breakouts
- Steer clear of traps such as false signals and emotional execution.
Think of the chart patterns as mental shortcuts: tools that allow you to gaze into the market potential of what the future might hold.
1. Head and Shoulders: The Reversal Signal
The Head and Shoulders pattern is one of the most reliable reversal signals in trading. The pattern has three peaks, with the highest one (the "head") positioned between two lower ones (the "shoulders"). When this pattern occurs after a strong upward trend, it often indicates the momentum has decreased.
Also, when this pattern appears after a downward trend, it is referred to as an inverse head and shoulders, which can signal a bullish reversal.
Why is it essential:
It allows you to become aware of trend reversals before they are complete, providing optimal entry or exit opportunities.
How to use it:
Wait for the break of the "neckline", which is the line that connects the low between the shoulders. That is often a confirmation signal.
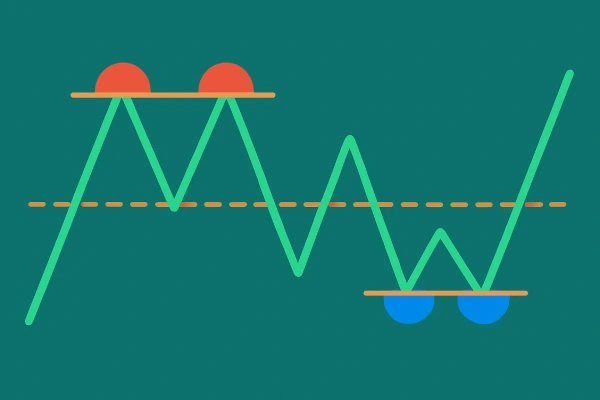
2. Double Top and Double Bottom: Classic Turning Points
These patterns are simple but can be well utilized. A double top occurs at the end of a solid upward move and indicates the price tested resistance unsuccessfully on two occasions. This means buyers are losing their position. A double bottom is the complete opposite. The price tests support and fail twice, indicating the price might pop out upwards.
Why is this important?
They are easy to identify and often appear in all markets and timeframes.
Tip:
Watch for volume confirmation. Volume should be lower on the second test, strengthening the probability of a reversal signal.
3. Flags and Pennants: A Continuation in Motion
Flags and pennants are continuation patterns, meaning they indicate that the market is taking a momentary break in its trend, much like a breath before it continues in the original direction.
•A flag forms as a small rectangle that slopes against the trend.
•A pennant looks like a small symmetrical triangle.
Both flags and pennants follow a strong move called a "flagpole," and typically will break out in the same direction as the move in the flagpole.
Why are they important?
They allow you to get into a trend before it has gone parabolic. Rather than buying at the peak of momentum, you wait for a healthy pause and get in at a better price.
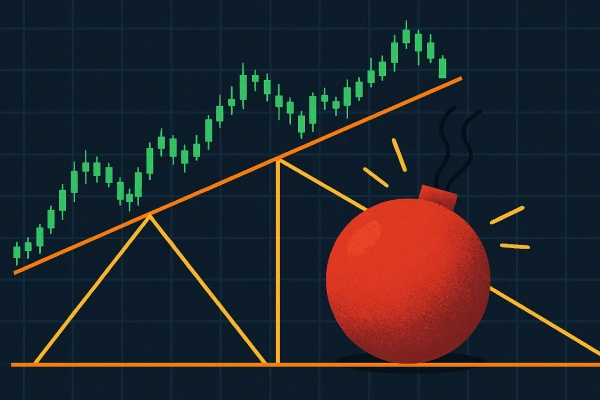
4. Triangles: Buildup of Pressure Before Breakout
In this sense, triangles can be viewed as a war between buyers and sellers. Over time, prices become increasingly squeezed until a breakout occurs.
There are three main types:
• Ascending triangle - it has a flat top and is uptrending from the bottom - bullish most of the time
• Descending triangle - it has a flat bottom and is downtrending from the top - bearish most of the time
• Symmetrical triangle - both sides converge - neutral until breakout
Why are they essential?
Triangles are like springs; the tighter of a squeeze the triangle makes, the more potent the breakout can be.
Pro tip:
Look for volume to indicate interest. Low volume during the formation period, combined with high volume on breakout, yields a powerful signal.
5. Support and Resistance: The Engine that Drives all Patterns
Support and resistance are not a "pattern" in the same way that a triangle, a wedge, or a cup and handle is a pattern, but they are both areas where the majority of patterns form. Support and resistance represent price points where sellers or buyers have stepped in to stop the trend in price before.
• Support - a price level at which, at least enough buying interest exists to stop the fall
• Resistance - a price level at which at least enough selling pressure exists to stop the rise.
Why you should care:
These levels are psychological; traders watch them, algorithms react to them, and they are often self-fulfilling.
Use case:
Use in conjunction with other patterns. A double bottom off support? That's a strong signal. What about a breakout above the resistance? Pretty good entry point.
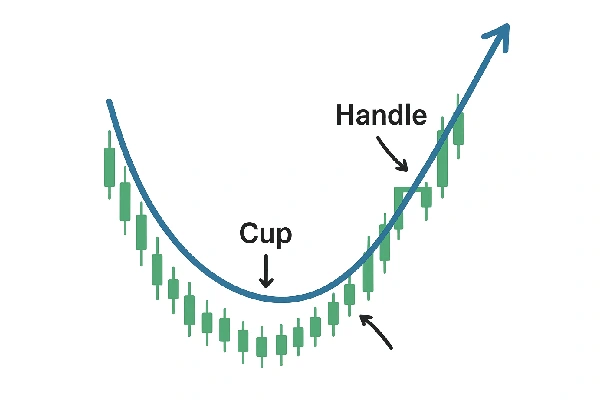
6. The Cup and Handle: A Gentle Set-Up
You guessed it - it looks like a cup with a handle. Price creates a rounded bottom (the cup) and then has a minor pullback (the handle) before breaking out in the upward direction.
It is generally considered a bullish continuation pattern that often develops in the context of a longer-term uptrend.
Why you should care: It shows healthy correction and then a second round of buying interest. It's slow and steady - a lot of time, slow is good in trading.
How to get better at spotting patterns
Chart patterns are not about perfection; they are about recognition. The more you look at charts, the more your eye starts to recognize the shapes subconsciously.
Here are some helpful tips to improve...
Backtest: To identify chart patterns and predict future outcomes, use historical charts.
Draw it out: Don't try to remember - draw trendlines, mark levels, draw patterns.
Use multiple timeframes: A pattern might look different on a daily chart versus on a 1-hour chart—everything has context
Be patient: Don't try to make a pattern out of nothing. If you're squinting at your screen, wondering if it's a pattern—it probably isn't.
Things to Avoid
1. Jumping the gun: Wait for confirmation (such as a breakout or volume spike).
2. Overthinking: Keep it simple. You do not need 10 indicators on your chart.
3. Not thinking about risk management: even if the pattern is perfect, it can fail. So always use stop-loss orders.
4. Looking for a pattern everywhere: not every movement is a set-up. Sometimes the best trade is no trade at all.
Conclusion
Recognizing chart patterns is not a magic bullet to guaranteed profits, but it is one of the most valuable skills to develop as a trader. Patterns help identify what others cannot see—they provide a framework, a model for your visual representations of the market, and a method for making decisions based on structure rather than randomness.
Start slowly. Learn a few stocks with a few patterns. Please pay attention to how they set up, how they trade, and how the market responds to them. Do this over some time, and those shapes will be as natural as breathing--Your trades will feel less random and more deliberate.
Ultimately, trading isn't about predicting the future. It's about reacting wisely to what the market is already telling you. And chart patterns? They're the whispers you learn to hear.
Continue Learning
What's Next?
Keep building your knowledge with our structured learning path. Each section builds upon the previous one.
This is the first section
You're at the beginning of your journey!
This is the last section
You've completed this course!