
Select your preferred language
Language changes will apply immediately
Select your preferred language
Language changes will apply immediately
What Are Bollinger Bands? Learn How to Trade Like a Pro
"Discover what Bollinger Bands are, how they work, and how to use them to analyze market volatility and identify trading opportunities effectively."
Wikilix Team
Educational Content Team
What if you could look at a stock chart and see not only the price, but how volatile or calm the markets felt? Without you having to exert extra effort, the Bollinger Bands can do this for you.
When the bands surround the price action, you have a visual envelope to see how stretched the markets are, how stable they are, and if they are breaking loose. Once you know you want to keep looking, it's because it gives you a whisper where there was once noise, helping you move forward.
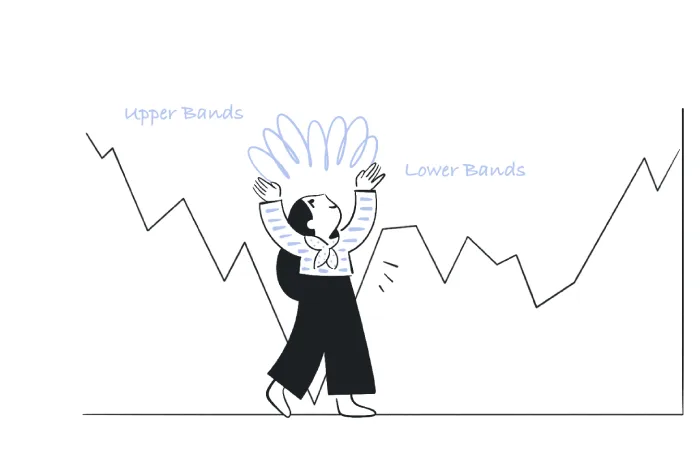
Bollinger Bands consist of three lines that hug a price chart. They are a central moving average, an upper band, and a lower band.
The central line is usually an average price (usually over a period of 20), and the outer bands are a fixed number of standard deviations above and below the average. The widths of the bands change depending on the volatility of the stock: they widen during turbulent markets and get narrower when things settle down.
Here's how they are created:
• Middle line: usually a 20-period Simple Moving Average (SMA).
• Upper band: SMA + (let’s say) 2 x standard deviation.
• Lower band: SMA - (the same standard deviation).
These configurations are the default 20 average, and two deviations, but of course, you can customize them to meet your strategy or timeframe.
In general, a price touching near the top of the upper band usually means an oversold condition, and touching near the lower band means an overbought condition. The markets do not always follow this rule exactly--the stronger the trend, the more price can travel along or even outside of the bands, which is technically more of a continuation signal than a reversal.
One of the interesting patterns that Bollinger Bands can represent is when the bands run very tightly together: what traders refer to as the squeeze. The squeeze indicates that volatility has significantly declined.
Historically, the squeeze usually produces huge price movements-the band can be thought of like a spring that has been very tightly coiled. The squeeze indicates a breakout will take place shortly...but you will have to be on your toes when trying to figure out what direction the market will be uncoiling.
See Bounce Strategy
If the price breaks below the lower band and then bounces back up towards the moving average, this is an ideal entry. Conversely, if the price touches the upper band and then retreats down, this is an indication to short sell, if confirmed with other rules. Ensure that volume or trend line indicators confirm the move so you don't get caught if it's a strong trend.
See Breakout Strategy (Post-Squeeze)
Should the bands squeeze tightly and then open rapidly to the sides, you may be looking at the start of something new. You can enter right at the point of breakout; use your confirmation (such as momentum tools), and you may have a setup that can ride that price move. But watch for head fakes—false breakouts where price suddenly reverses—so use your stops carefully.
When changing the period (for example, 14, 20, and 50) and deviation level (1.5, 2, and 3), the bands become more or less sensitive. When you have tight settings, they give better signals, but there is also more noise.
When using wide settings, they smooth out the noise, but also lag. Remember that Bollinger bands work across charts—intraday, daily, or weekly —so why not use all time frames to show better entry zones and avoid false signals?
Strengths:
• Visually intuitive and adjusted to volatility
• Easily used across all different markets – stocks, currencies, and commodities
• Great for spotting squeezes, over extensions, and extreme moves or trends
Weaknesses:
• Not foolproof as price can stay past the bands in strong trending moves
• Fault signals in choppy market conditions
• Works best when paired with other indicators, such as momentum or volume
What is unique about Bollinger Bands is their adaptability; they flex automatically to changes in volatility, as opposed to fixed support/resistance lines. In fact, they combine trend direction and volatility into one easy-to-view visual tool. This is very handy for traders wanting to simplify their view of their trading opportunities without making their screen messy and confusing.
In summary, Bollinger Bands provide a robust and dynamic view of price behavior:
• The middle line indicates the direction of the trend
• The outer bands show the strength of volatility and possible extremes
• Just because the price has moved inside a squeezed area indicates an imminent breakout; an expansion / sharp movement suggests momentum.
• The real ' edge' lies in changing the different settings, combining with other required tools, and observing across time frames as well.
Consider your Bollinger Bands as a dramatic change in skin tone, providing how heated or calm it really feels to you; with practice, you can first sense when to hold, when to act, and when not to act. If they are used wisely, Bollinger bands are more than just some bands: they give insights into combinations in motion.
Keep building your knowledge with our structured learning path. Each section builds upon the previous one.
This is the first section
You're at the beginning of your journey!
This is the last section
You've completed this course!
12 min
Reading time
Beginner
Difficulty
