
Select your preferred language
Language changes will apply immediately
Select your preferred language
Language changes will apply immediately
Breakouts with Pivot Points
"Learn to identify and trade breakouts using pivot points. Learn when confirmed signals for a breakout occur, how to set targets, and how to manage risk to make better trading decisions."
Wikilix Team
Educational Content Team
Imagine this: you're observing a stock consolidating around a familiar price level. Then it suddenly vanishes from that Price, where previously interested market participants are violently chased away. Well, was it luck? Absolutely not. It was likely a pivot point, and the active traders took advantage of the breakout.
In this article, we will discuss in detail how pivot points can be used to identify high-probability breakout opportunities. You will learn about the concept of pivot points, how to calculate them, how to interpret price behaviour around them, and the approaches professionals take to these opportunities.
Pivot points are calculated levels based on the previous day's high, low, and close prices. They exist as invisible markers on your chart, identifying areas where market participants are most likely to show interest in supporting or rejecting the Price.
As Price converges upon one of these pivot levels, it tends to create significant reactions – either:
• Rejects that level and consequently reverses; or
• Breaks through that level and moves significantly in one direction or the other.
This makes pivot points an invaluable tool for breakout traders who want to premeditate their entries and exits from the actual market.
The classic (floor trader) formula is by far the most widely used method:
Pivot Point (PP) = (High + Low + Close) / 3
Resistance 1 (R1) = (2 × PP) – Low
Support 1 (S1) = (2 × PP) – High
Resistance 2 (R2) = PP + (High – Low)
Support 2 (S2) = PP – (High – Low)
Some traders also calculate R3 and S3 for extreme moves; however, the pivot point (PP), resistance 1 (R1), support 1 (S1), resistance 2 (R2) and support 2 (S2) will suffice for structure to derive a breakout setup.
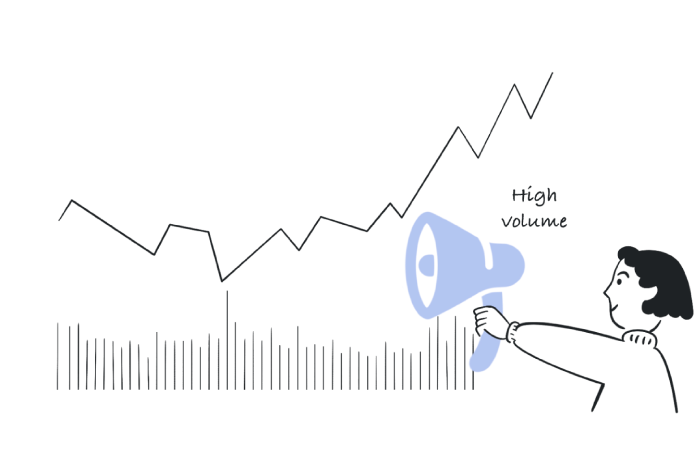
Pivot levels work really well because converging market psychology often surrounds them. Institutional traders, algorithmic traders, and retail investors are all aware of pivot points because they are transparent levels that traders' attention usually congregates around.
So when Price builds up to a pivot level, and it breaks through with direction and volume, it will often trigger:
• Stop losses (as trapped traders are hunted out of their positions),
• Momentum buying and/or selling (as breakout participants enter positions), and
• Institutional flows exploiting the liquidity zones.
The result? Fast, high-probability moves.
Here's how to recognise a true breakout versus a false one:
Signs of a Strong Breakout: Red Flags of a False Breakout
Clean close above R1 or below S1. Wick-heavy candles with no follow-through
Rising volume at breakout moment, Weak or declining volume
Breakouts aligning with trend Counter-trend breakouts lacking context
Retests holding the broken level, Price snaps back into the old range immediately
Influence Assessment: Pivot Point Breakouts
Once the Price has broken above R1 or R2, traders can assume buyers are in control therein:
- Your Entry: Place a buy order above the breakout candle.
- Target: Next resistance level, either R2 or R3, or a measured move projection.
- Stop-Loss: Just below the breakout itself, should the opportunity fail.
For bearish setups, we like to focus our attention on S1 and S2.
- Your Entry: Short when the Price closes decisively below the pivot support.
- Target: Lower support levels or, based on momentum, a trailing stop.
- Stop-Loss: Slightly above the broken support.
For cautious traders, we recommend waiting for the Price to break, pull back & retest the pivot level.
- If the breakout is valid, the old resistance will now act as support and vice versa.
- This scenario reduces the chances of a false breakout while keeping potential profit levels high.
Imagine yesterday's high is $150, low is $140, and the close is $145:
- PP = (150 + 140 +145)/3 = $145
- R1 = (2 × 145) – 140 = $150
- S1 = (2 × 145) – 150 = $140
During today's session, the Price is flirting with $150 and then breaks through R1 on increasing volume.
- Entry: Buy at $151.
- Target: Next calculated resistance R2 = $155
- Stop: Just below $150, to manage risk
This trade is systematic & eliminates any guesswork – instead, you wait for the market to confirm while allowing the opportunity to unfold.
- Always monitor market volume: If there's no volume, there's no conviction.
- Trade with the trend: Breakouts in the direction of the trend are the best (and most reliable) trading opportunities.
- Use multiple timeframes: Intraday levels can help confirm higher timeframe pivots.
- Use with other tools: If your pivot level aligns with a moving average, Fibonacci retracement, or a supply-demand zone, it becomes a strong resistance/profit target.
- Be patient: The market tends to touch pivots often — not every time you see a pivot should you be acting.

- Chasing every trade: Only trade breakouts with good evidence behind them.
- Not respecting retests: Some of the best and cleanest entries are after a retest —don't rush in.
- Overleveraging: Breakouts fail from time to time — be sure to respect and adjust your position size accordingly.
- Forgetting the bigger picture: News or significant economic events can easily have more influence than any setup, regardless of its merit.
Professional traders often utilise all these pivot types in conjunction with one another.
- Using classic pivots in combination with Fibonacci pivots helps create layers of targets.
- Utilising Camarilla pivots provides additional structure when intraday trades are targeted toward tighter levels.
- Comparing weekly pivots with daily pivots is another way to filter weak setups.
The areas where different systems converge can signal above-average-probability zones.
Those breakouts around pivots aren't random - they reflect where the market is placing its attention; by weighing these levels in advance, you are preparing yourself for a higher probability move as opposed to reacting to chaos.
With a systematic approach:
- You know where the Price is likely to move,
- You define your entries and exits with confidence,
- And you manage risk instead of chasing impulses.
When traded with discipline, pivot points make breakouts less chaotic explosions and instead help turn them into calculated opportunities. Develop your skills with pivot points, and you will trade with precision, clarity, and confidence in even the most action-packed markets.
Keep building your knowledge with our structured learning path. Each section builds upon the previous one.
This is the first section
You're at the beginning of your journey!
This is the last section
You've completed this course!
15 min
Reading time
Beginner
Difficulty
