
Select your preferred language
Language changes will apply immediately
Select your preferred language
Language changes will apply immediately
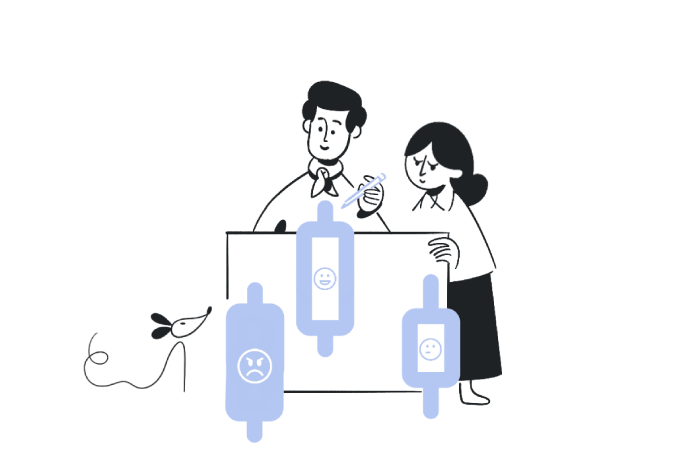
Candlestick Anatomy
"Discover the anatomy of Japanese candlesticks and learn how each part reveals market trends, price movements, and trader psychology in a simple, beginner-friendly guide."
Wikilix Team
Educational Content Team
When we think of trading charts, we often think of charts filled with candles of various colors. When looking at this chart as a brand new trader, it may look like complete chaos to the untrained eye - it just looks like a mishmash of red and green shapes that are piled on top of each other.
What you have with each candlestick is a mini-story about trader psychology, negotiations in the market, and price. If you learn to "read" the candles well enough, it is almost like you have complete access to the heartbeat of the market.
In this article, we will go over candlestick anatomy in all its glory. We will explore the physical components of the candlestick, its meaning, and how it appears in real-world trading scenarios. By the end of this article, you should have a basic framework to help you read and interpret the market's sentiment with candlesticks, whether you are brand new to trading or have years of experience trading.
Every candlestick is made up of four main price points (OHLC). The four main price points are:
• Open: This is the price when the trading session begins.
• High: The highest price that was reached during that period.
• Low: The lowest price that was reached during that period.
• Close: The price when the trading session ended.
These four numbers represent the price trajectory in that period alone. For example, a session that opened low, rallied, and closed at the day's highs tells a different story than a session that opened high and closed at the lows. We can work some magic when we visually represent this information using candlestick anatomy.
The real Body is the filled box that is the space between the open price and the close price. The length and color will provide an instant indication:
• Color (or Fill):
o Green / Hollow Body → the closing price is higher than the opening → buyers clearly in control.
o Red / Filled Body → the closing price is lower than the opening → sellers clearly in control.
• Length:
o Long Body → firm conviction and decisive movement one way.
o Short Body → some level of uncertainty or balance of buyers and sellers.
Think about the Body as the primary communication of the candle; it is telling you who is winning the battle during the session.
There are thin lines either above or below the real Body that are called sticks or shadows (sometimes also wicks and tails). They mark price extremes during the session.
• Upper Shadow → The highest price the price reached before it retreated.
• Lower Shadow → The lowest price reachable before bouncing back.
The lengths of the shadows tell us about the struggles and tensions during the intra-session time:
• Long Upper Shadow → buyers obtained prices, but sellers regained control and pushed prices down.
• Long Lower Shadow → Sellers tried to push prices down, but buyers pushed back.
• No Shadows → This is rare and a powerful signal that one side dominated prices.
When you are cognizant of sticks, you are aware of a different kind of volatility and area of prowess that allows for greater realization.
A special form of candlestick, Marubozu, has absolutely NO shadows. As such, it represents that the price has momentum in one direction or the other.
• Bullish Marubozu: Opens at the session's low and closes at the session's high → buyers owned all of that day/session.
• Bearish Marubozu: Opens at high and closes at low → there was no doubt that the sellers were in control. The entire session was sellers only.
Marubozu candles typically occur in a strong trend or just before a significant breakout. A marubozu is a trader's way to recognize "no-nonsense" behaviors of the market.
The Doji is an interesting shape because the opening and closing price levels are so close that you deem them to be the same. The doji usually has little or nonexistent bodies and often long wicks, which indicate that the market was unable to make a decision, as it was caught between buyers and sellers.
Types of Doji:
• Standard Doji: The doji is balanced exactly between open and close
• Dragonfly Doji: the doji will have a long lower shadow and no upper shadow, suggesting it will create a bullish reversal
• Gravestone Doji: the doji candle will have a long upper shadow and no lower shadow, suggesting it could have bearish implications.
Doji candle indicators typically indicate the market is undecided, but within a trend, it matters more in the overall context before further confirmation.
To learn how to fully "read" a candle, you need to combine the Body and the shadows to get an overall picture of the market:
• Long Body + Short Shadows → overall momentum suggests staying in the trade - most likely continuing in trend
• Short Body + Long Shadows → gets into some volatility with hesitation
• The Doji at support/resistance → represents indecision and could represent a reversal.
Translating the Anatomy into psychology is what separates an observant participant from an informed trader.
Multiple Timeframes, Multiple Stories
The same candlestick could mean something different based on the timeframe:
1-Minute or 5-Minute Chart: Ideal for scalpers seeking quick profits.
Daily Chart: Great for swing traders looking to capture medium-term setups.
Weekly or Monthly Candles: Help clear out the short-term noise, illuminating larger cycles in the market. It is essential to master anatomy across all three timelines, as this will help students identify patterns and trends in their studies.
Once you have learned the anatomy of candlesticks, it will be much easier to identify patterns. Here are a few classics:
Engulfing Patterns: A large candle essentially "engulfs", or swallows, the Body of the previous candlestick; these signify changes in momentum or reversals
Hammer & Hanging man (not the yi-haw type): Small bodies with long lower shadows (bullish if before a downtrend; bearish if following an uptrend;
Morning Star/ Evening Star: Three-candle patterns indicating potential trend reversal in the market.
All of these patterns start with a single candle. Once you have a good understanding of anatomy, patterns will become obvious.
Even with a good sense of candlestick anatomy, there are still the following common mistakes that will affect beginners.
It is essential to look at the context of price action. For example, a bullish candle in a downtrend isn't going to mean much.
Too Reliant on Candles: Always look for confirmation by patterns and indicators.
Forgetting Volume: A candlestick with a strong, mind-blowing candle look but very low volume will skew your signals.
Avoiding these common mistakes will make candlestick analysis much more reliable.
Backtest Your Findings: Study in your free time, analyze historical charts to develop your instincts.
Use Candlesticks in conjunction with other tools: You can easily incorporate candlesticks with indicators like RSI or MACD, for example.
Be Patient: It takes time and screen time to be able to identify subtle cues.
Stay Objective: Don't let your feelings interpret the candle, just stick with the facts that the candle is telling you.
When discussing candlestick anatomy, we're not just learning about shapes; it's similar to anything else: you need to consider the emotions driving price action. Every candle has a story in it: Who was controlling the price? When did they falter? Where did momentum shift? Once you master reading the real Body, shadows, and special names, you will have a useful edge.
When you glance at your following chart, you won't just see plain red and green boxes; you will find meaning. With time and thousands of candles, you will be reading candlesticks fluently, making decisions that enable you to act, react, and stay ahead of the market.
Keep building your knowledge with our structured learning path. Each section builds upon the previous one.
This is the first section
You're at the beginning of your journey!
This is the last section
You've completed this course!
15 min
Reading time
Beginner
Difficulty
