
Select your preferred language
Language changes will apply immediately
Select your preferred language
Language changes will apply immediately
Candlesticks with Support/Resistance
"Discover how to use candlestick patterns and support and resistance levels to spot trend reversals, validate breakouts, and make better trading decisions."
Wikilix Team
Educational Content Team
Picture yourself looking at your trading chart. The price is approaching a level it has tested multiple times before, it pauses, and then... Something happens. A candlestick forms that seems to "speak" to you, hinting at whether the level will hold or break.
This is where candlestick patterns, support, and resistance levels intersect, sometimes in a way that complements and sometimes conflicts with points of technical analysis, and turns them into something actionable in your trading decision-making process.
In this article, we will cover how candlestick formations and critical price levels can come together, how to identify high probability setups, and how to use this powerful combination to make better, more confident trading decisions.
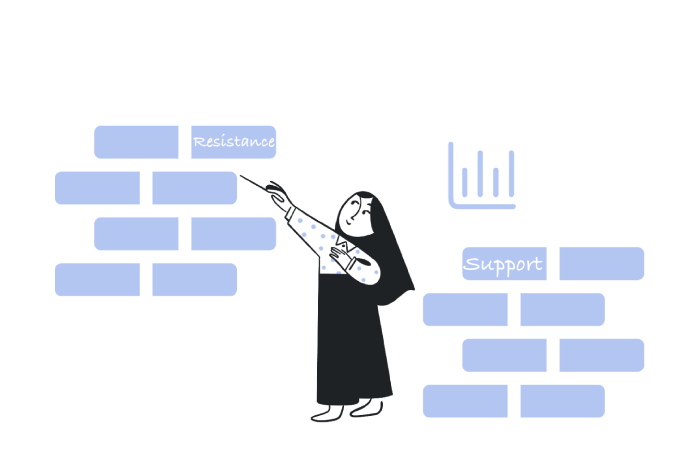
Support and resistance levels act like invisible barriers on a price chart.
• Suppose price starts to fall; in that case, support is where it is likely to stop and reverse back up when buyers are interested enough to step in.
• Suppose price begins to rise; in that case, resistance is where it is likely to stop and reverse back down when sellers become interested enough to re-enter the market.
These levels create battlegrounds, or zones, where traders are active and engaging the market. When you utilize candlestick analysis in addition to support and resistance, you have a much better understanding, not only of where price might react to the level, but also the rationale behind it.
Candlestick patterns reveal market psychology in motion: fear, greed, hesitance, and conviction. Around support or resistance zones, this sentiment can be heightened. A single candle can inform you whether buyers are defending a level or sellers are prepared to break the level. By analyzing candlecandle context, you can help eliminate false signals and focus on price action setups that are more likely to be valid based on structural levels.
• At Support: A hammer candle with a long lower wick indicates that sellers attempted to push the price to lower levels but failed, and therefore represents a potential upward reversal.
• At Resistance: A shooting star candle with a long upper wick indicates that buyers made an attempt to push prices to higher levels, but failed, therefore suggesting that the sellers may have pressure coming.
• Bullish Engulfing at Support: Suggests that buyers are starting to push control at support and often signals that price has the potential for upward reversals.
• Bearish Engulfing at Resistance: Suggests that sellers are pushing through and overpowering buyers, often signaling that the price could drop.
As mentioned before, the doji represents indecision. When they form at high structural support or resistance, they tend to indicate big moves are coming - unless, of course, the next candle does fail as a breakout or reversal.
• Morning Star at Support: A bullish reversal after the price has been moving downward intensely for a long time.
• Evening Star at Resistance: A warning of possible bearish reversal near the top of the move in a down structure or maturing trends.
Confluence happens when you get multiple signals at one point:
• A candlestick pattern happens.
• Price is at a significant support/resistance zone.
• Volume or other indicators suggest a possible change is nearing.
When the three items line up directly, the probability of your candlestick setup dramatically improves.
Use historical price data to identify levels where the price is bouncing and moving away from its previous level significantly. The more opportunities a level is tested, the more reliable the level will be.
When the price reaches these levels, assess how the candlesticks react.
• Patterns that show reversal at strong support | resistance levels are more substantial indications.
• If you see weak candles or indecision happening, it's best to wait for confirmation.
A bullish engulfing candle at a support level, with high volume, is better than one shown on a low-volume range.
Entry: Wait for confirmation of reversal | breakout
Stop-loss: just one tick beyond the opposing side of the candlestick pattern
Take Profit: as close as possible to the next support | resistance level
Support and resistance price zones, along with candlestick patterns, exhibit greater reliability on daily and weekly timeframes compared to intraday data.
• RSI: Shows/or confirms overbought or oversold zones where reversal price action can happen
• MA: three nice confluence points, support/resistance moved, and MA has a crossover
• MACD Divergence: creates a perfect alignment with candlestick formation | reversals
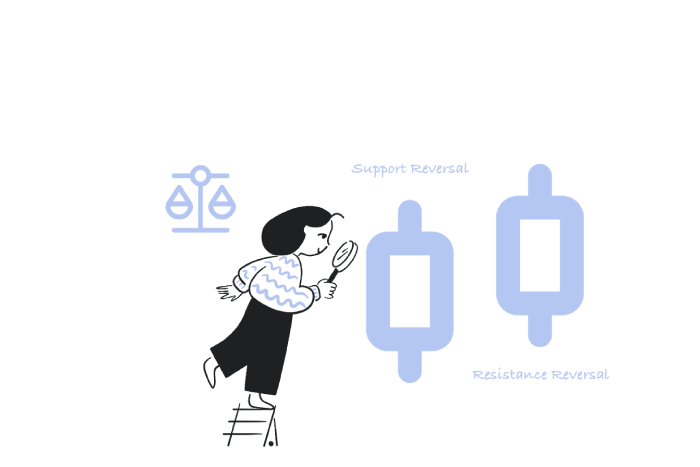
In some instances, price will pierce through levels briefly before reversing sharply; they are a "fakeout". Look for candle closes to help with fakeout filtering.
1. Trading Every Pattern
Not all candlestick setups near support/resistance are going to be worth trading. Focus on a clearly defined, well-formed pattern for the best chances of success.
2. Overlooking the Bigger Picture
Never judge candles without looking at the broader trend.
3. Too Soon
Patience is a virtue! Waiting for confirmation makes you more accurate.
4. Poor Risk Management
Perfect setups can fail. You need to determine your stop-loss and manage your position size.
Scenario 1 – Bullish Engulfing at Strong Support
A stock falls to historical support, a bullish engulfing candle appears, and rising volume shows up. In the following sessions, we see a clear rally; the traders who entered with confirmation from this were rewarded on their position.
Scenario 2 – Evening Star at Resistance
A currency pair approaches and tests the resistance levels of the last known position. Then suddenly, as if out of nowhere, the evening star pattern shows up, followed by a significant drop. A trader who is paying close attention and anticipates this reversal can benefit by shorting early, with close stop-losses placed above resistance levels.
Scenario 3 – Fake Breakout
Price moves above resistance briefly. The wick of a shooting star candle creates long spikes and then closes back below resistance. This fakeout potentially traps aggressive buyers, who are only provided a low-risk short-entry opportunity for patient traders.
To use candlesticks and support & resistance, and formulate a structured approach:
• Plan! Plan! Plan! Mark out primary levels before trading each session.
• Confluence. Look for multiple patterns, levels, and indicators to make your signals stronger.
• Work on journal trades. Keep track of setups, the outcome, and your observations to improve your process.
• Backtest, Backtest and Backtest again. Look at the historical charts to gain a deeper understanding of the situations and expectations of the patterns.
There is power in a candlestick pattern; there is definite value in support and resistance levels analysed about price action. However, when you put these together, you then become far more adept at delving into the market psychology that candlestick patterns help express in the context of the price structure. You are no longer just a candle spotter, you are interpreting the comprehensive story it weaves amongst the larger context of the price action.
A successful trader does not need to make all their market moves perfectly correct. Recognizing high-probability setups and implementing appropriate risk mitigation should give them the confidence to pull the trigger. Understanding how to effectively use candlestick patterns in conjunction with support and resistance levels will provide traders with an edge in the markets, which does not consider chance but is based on a trading strategy that comes from an understanding of the markets.
Keep building your knowledge with our structured learning path. Each section builds upon the previous one.
This is the first section
You're at the beginning of your journey!
This is the last section
You've completed this course!
15 min
Reading time
Beginner
Difficulty
