

Common Mistakes in Using Candlestick Patterns
Common Mistakes in Using Candlestick Patterns
"Discover the most common mistakes traders make when using candlestick patterns and learn how to avoid them for better trading results."
Wikilix Team
Educational Content Team
14 min
Reading time
Beginner
Difficulty
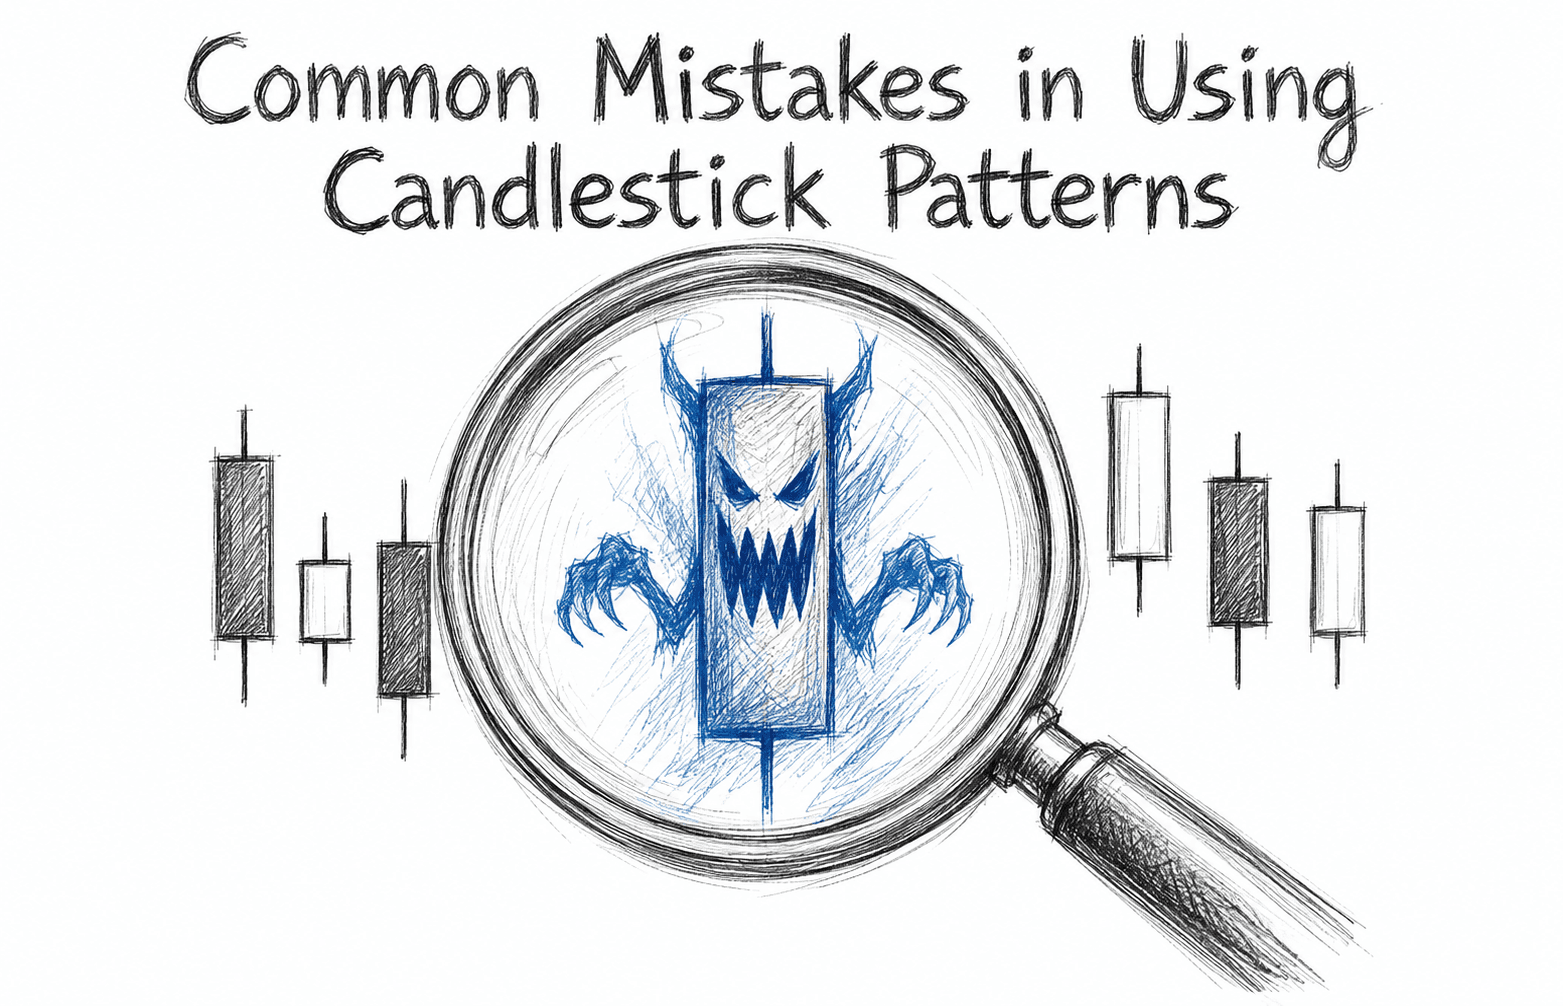
When first looking at a chart filled with candlesticks or patterns, it can almost feel like you have discovered a secret language—a way, actually, to see what the Market is thinking. It doesn't take long before even the most seasoned traders find themselves in trouble. A misreading, overconfidence, or ignorance of context can turn a "sure signal" into a loser.
In this article, we will discuss some of the more common mistakes that people make when using candlestick patterns, along with some best practices to mitigate downside risk, thereby ensuring that your analysis of a chart becomes more reliable.
Assuming Every Candlestick Has Meaning
One of the biggest pitfalls is the assumption that every single candlestick has a specific meaning. The Market creates noise—moves that do not reference anything meaningful. If you treat every little candle as something that could go into some potential pattern, you will be chasing rainbows.
Instead, focus on candles that form at critical zones, such as support and resistance levels, trendlines, and other key areas. Ask yourself: Is the pattern formed at some significant level? If not, it is noise.
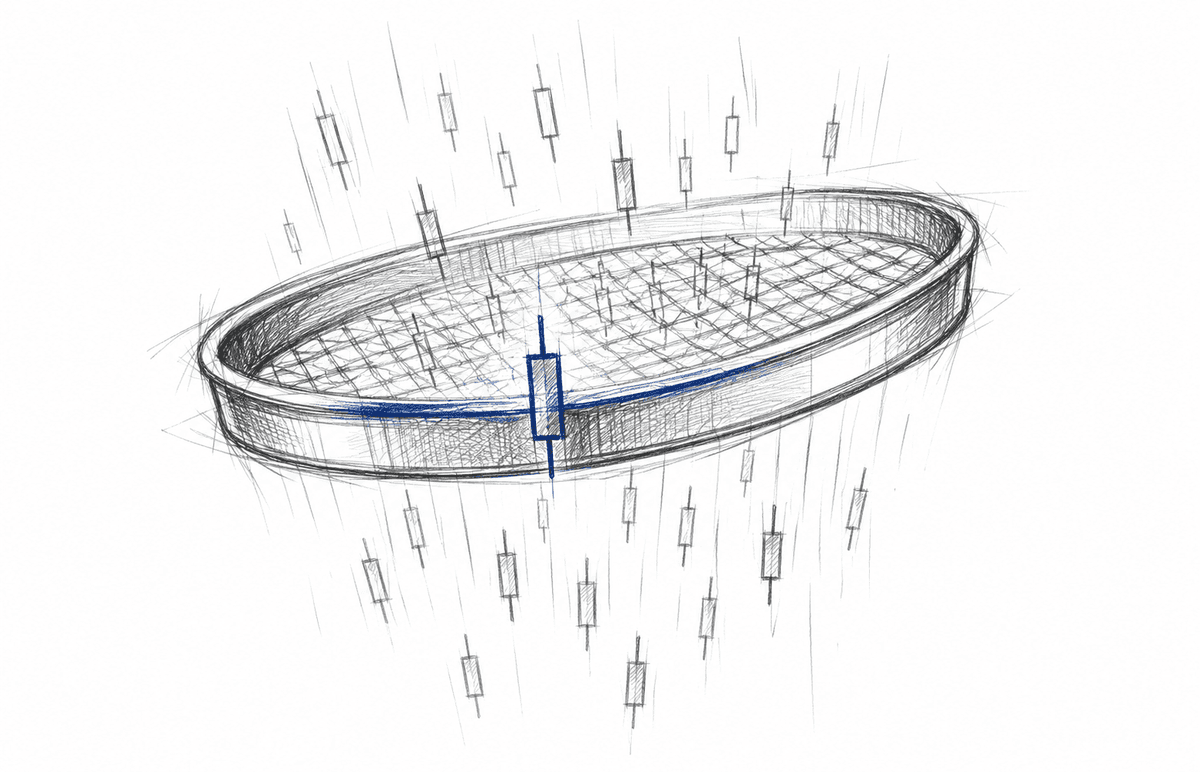
Trading Patterns in a Vacuum
Many traders will see a Hammer or Engulfing pattern and trade immediately, without considering the context. Always keep in mind, candlesticks do not exist in a vacuum. Similarly, a bullish reversal candle in a powerful down trend is much less reliable than the same candle in a sideways market.
Always pair candlestick signals with context: direction, volume, momentum indicators, or structure on a higher time frame. A pattern that is signalling something in the direction of the trend and confirmed by volume is infinitely more reliable than a pattern alone.
Remembering All Candlestick Patterns
Some traders attempt to memorize them all. Here is the potential problem: you will see a match even when there is none, simply seeing what you want to see.
Better the practice: internalize the price-action logic behind the patterns. Ask yourself:
• Did the price reject the lows?
• Did buyers push back firmly after the price dropped?
• Is the price action larger than the candles that preceded?
When you think "this is a Harami" to "the price showed strong rejection…" you are thinking less about the pattern and more about what the Market is doing.
Not Waiting for Confirmation
A classic mistake: trading before the candlestick is fully formed, or confirmed. What you could see happening, observing the candlestick, could reverse one more time in the same candlestick, or the next candlestick could negate what you saw.
Best practice: wait for the candle to close, then look to confirm (e.g., the next candle in the direction of the pattern, a break of high/low). This delay will save you more times than not from making early or false signals to trade.
Not Using Volume or Momentum
Candlestick patterns show you what price did; volume and momentum show you how strong it was. A reversal candle forming on weak volume would signify far less trustworthiness than a candle with substantial volume or momentum. If you see weak momentum behind the move, the pattern could fizzle.
So always check to see if the pattern you are considering using was accompanied by meaningful volume or momentum. If the price pattern is not accompanied by volume or momentum, consider caution; if not, avoid the trade altogether.
Losing Sight of the Bigger Picture (Multi-Timeframe Blindness)
When you focus exclusively on one timeframe (like 5-minute) without looking at the Daily or 4-Hour charts, you are definitely painting yourself into a corner. A powerful-looking candlestick pattern on a lower timeframe may be entirely misleading in relation to the Daily trend.
To overcome this, adopt a top-down approach: always start with a higher timeframe to see the trend direction and primary structure, then scale down to examine the candlestick formations. This Way, your trade is not fighting the larger trend.
Questionable Risk Management Practices and Lack of Entry and Exit Criteria
A seemingly perfect candlestick signal can result in a loss if risk management practices are inadequate. Most individual traders do not implement adequate stop-loss levels, fail to develop targets, or don't account for the correct position size.
You should always pre-determine:
• Where will I place stop-loss (e.g., below the lows of the pattern)?
• What is my minimum reward-to-risk ratio in each trade?
• When will I exit, if it goes sideways, or reverses?
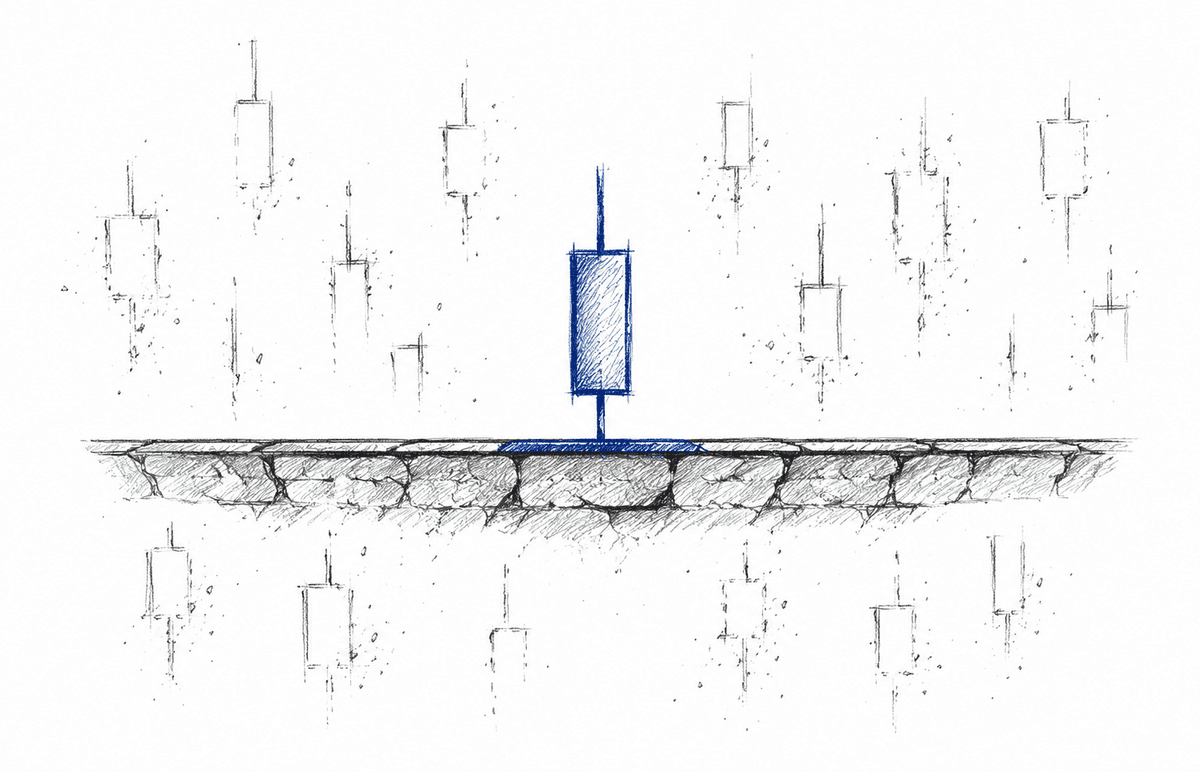
Emotions and Overconfidence Getting in the Way
Once you see a "perfect" pattern, it is easy to throw all caution to the wind, override your rules, or enter before you should because it just feels "right."
To help combat this, use a checklist or some pre-trade routine. If you review your checklist and it does not meet your rules, even if the setup appears great, do not take the trade. In trading, discipline will always trump enthusiasm.
Ignoring Backtest Patterns in your Market
A popular pattern does not necessarily mean it will work as well in your Market (stocks, forex, crypto, commodities). If it works in one asset type and time frame, it may fail in another asset or time frame.
Make sure you take the time to scan observed data and test out how a pattern behaves in your Market and time frame, understand its reliability historically over time, and any quirks a pattern might have before you trade live.
Overtrading and Chasing Set Ups
Once you start seeing patterns everywhere, you may find yourself forcing a trade just because "a candle popped," and this will lead to over-trading. Some of your entries will be weak, and as a result, they will significantly reduce your overall successful trades.
A more effective approach would be to wait for a high-probability setup. If it doesn't present itself, sit it out. It's perfectly okay not to have to trade every day.
Conclusion
There is a lot of power in candlestick patterns—however, they are not magic. Many traders fail not because the patterns are inadequate or ineffective; they simply misuse them by:
• Treating noise as signal
• Not thinking context
• Relying on 1 time frame
• Skipping confirmations
• Failing to manage risk effectively
If you want to improve your skills:
1. Study the why of the candle pattern, don't rely on just the name.
2. Remember to think about the broader trend, volume, price making a higher high, etc.
3. Always validate your setup using multiple timeframes.
4. Practice disciplined risk management.
5. Backtest using your specific markets and timeframes before going live.
6. Only trade when your established checklist fully satisfies your parameters.
Over time, you will stop looking at random candles as a signal and will start seeing real opportunities. You will process chart readings consistently, following rules, and trade less impulsively, keeping you sharp and winning.
Frequently asked questions
Answers to the questions readers ask most about this lesson.
Comments & Reviews
0 entries
Nothing on the record yet
Be the first to share what happened.
What's Next?
Keep building your knowledge with our structured learning path. Each section builds upon the previous one.