
Select your preferred language
Language changes will apply immediately
Select your preferred language
Language changes will apply immediately
Doji Patterns
" Learn everything you need to know about Doji candlestick patterns, the different types of Doji, their meaning, and how to trade them to identify trends in the market and indicate reversals."
Wikilix Team
Educational Content Team
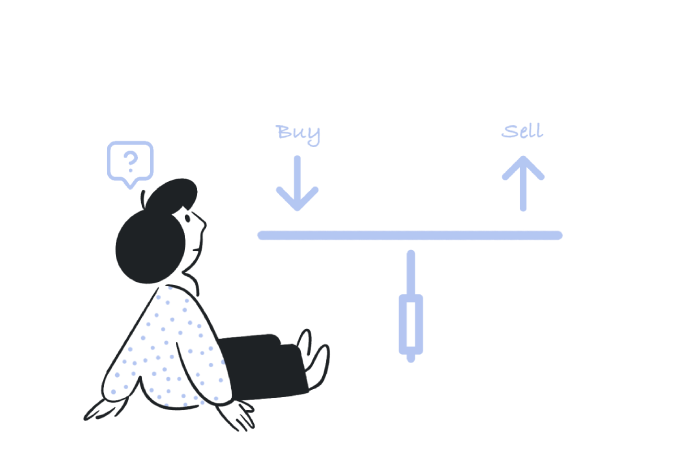
You are looking at your chart, and you see a little candle that is almost nonexistent, but has long wicks above and below, and they look like little question marks. At first glance, the candlestick seems unassuming. That's the thing, though--this simple little candle could be the best indicator if an existing trend is about to stall, reverse, or continue.
Welcome to the world of Doji patterns--candlesticks that provide you insight into uncertainty, indecision, and possible opportunity. Regardless of whether you are a beginner or a long-time trader, there is more to learn about Doji patterns that could change the way you read price action thoroughly. Stay with me, and you will know what they mean, how to find them, and, most importantly, how to trade them with conviction.
A Doji is created when the opening price and closing price of an asset are almost the same, and hence, the candle leaves an extremely small or even nonexistent body. Doji candles can have either long upper or lower shadows. The lengths of the wicks vary, thus defining several different types of Doji.
Essentially, a Doji candlestick represents indecision in the market, indicating that neither buyers nor sellers have determined a preference, with a balance between them serving as a determinative structure. The visual representation of Doji patterns can be fundamental; however, their respective locations within the pattern are paramount to making a proper decision.
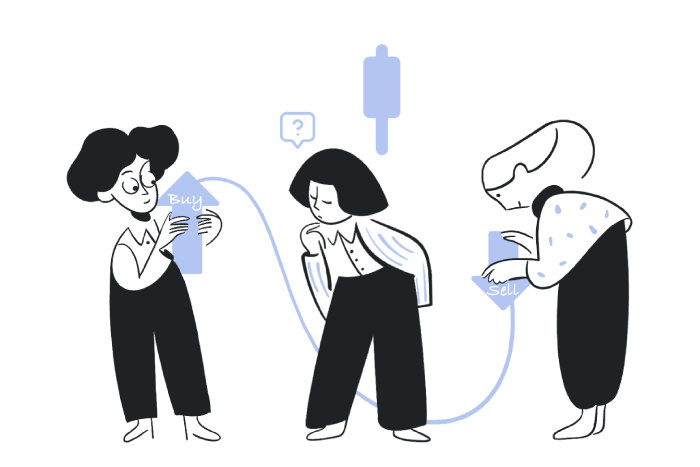
To convey a better entrenched understanding of Doji patterns, you need to contextualize your thinking in the mindset of a trader.- When buyers and sellers tussle ardently, but the price manages to close where it opened, it indicates indecision.
- Bulls wanted to push the price up, while bears wanted to pull the price down - neither was able to gain the advantage.
- This "tug of war" often is the prelude to breakouts, trend reversals, or strong trend continuations.
In other words, Doji candles represent a market that is at a crossroads. Astute traders do not ignore them - they prepare for the next move!
There are different types of Doji formations - and they have slightly different meanings. Below are the most common:
• Looks like: A cross shape with long upper and lower wicks.
• Means: Extreme indecision; this formation often presents itself immediately before the reversal of the trend or significant breakout.
• Looks like: A candle with a long upper shadow, and that has open, low, and close prices near the bottom of the candle.
• Means: Sellers regained control of the market after the bulls could not keep it up at higher prices. When it appears at the peak of an uptrend, the gravestone doji is typically extremely bearish.
• Looks like: A capital "T" shape. It has a long lower wick, and the open/high/close are grouped closely together near the top of the upper candle.
• Means: Sellers tried to push the price downwards but failed, leaving the room for bullish sentiment to flourish. When it's present, it often seems possible to make upward reversals.
- Four Price Doji
• Looks like: A rare candle where the open, high, low, and close are all in the same area.
• Means: Extreme indecision in a market often occurs in periods of very low volatility.
A Doji candle alone isn't enough for a trading decision; where it falls on the chart makes a difference.
• At the top of an uptrend: may indicate a loss of bullish momentum → potential M-shaped reversal.
• At the bottom of a downtrend: may indicate lifeless sellers → potential bullish bounce.
• During consolidation: represents indecision → doesn't imply a change in trend unless we confirm.
The golden rule? Doji is a clue, not confirmation. Follow what happens next.
Step 1. Wait For Confirmation
Don't just trade because you see a Doji. Focus on the next candle.
• If it closes in the opposite direction, the reversal signal gains strength.
• If it closes in the same direction, typically the trend continues.
Step 2. Use Indicators
Using indicators like the following will help increase your odds when combined with Doji signals:
• RSI: overbought or oversold zones give you weight on reversal setups.
• MACD: divergences and Doji candles can be a powerful combination.
• Moving averages: notice Doji patterns forming near firm support or resistance levels.
Step 3. Smart Stop-Losses
• For bearish setups, you want to make sure you set stops above the Doji upper shadow.
• For bullish setups, you want to make sure you set stops below the Doji lower shadow.
This protects you from risk if the signal does not develop.
1. Traders enter positions without confirming the Doji pattern and the next candle.
2. Traders forget to take into account the larger context, trend, and support/resistance areas.
3. Traders rely too much on the Doji patterns, and not every Doji signifies a reversal pattern;
Sometimes it reflects how the buyers are hesitating for a short period.
4. Positioning risk management aside, Doji setups fail like any other pattern - position sizing will save traders.
Let's illustrate this with two examples:
Example 1 - Gravestone Doji Top of Market
A stock that has rallied for weeks is preparing to hit a key resistance level. The stock rallies and forms a Gravestone Doji, followed by a highly bearish candle. Most traders recognize the market's peak and exit their long positions in the stock. Traders who have taken a trade based on the Doji warning have avoided a significant drawdown.
Example 2 - Dragonfly Doji After a Sell Off
After a significant sell-off in price, a Dragonfly Doji appears at a key support zone. The next day, a large bullish candle indicates buying pressure has come back into the market. Early entry points allow traders to increase their stock position sizes while keeping risk minimal.
If you want to take Doji trading to the next level:
• Consider volume analysis: High volume on a Doji indicates more conviction behind the next move.
• Use multiple time frames: Confirm the Doji with the higher time frame for more peace of mind.
• Backtest your setups: Backtesting your Doji setups creates a historical comfort level for you and avoids impulsive trading decisions.
Doji patterns may look small and reliable, but there is possibly more information about trader psychology behind this small candle pattern than larger candles suggest. Doji patterns give insight into when the market has reached a point where buyers can balance out sellers, and that sense of balance creates the conditions for huge moves.
By understanding the three main types of Doji candles, considering Doji candles in the context of their surroundings, and pairing the Doji candles with signals responding to the uncertainty of buyers and sellers, traders can transform their sense of indecision into opportunity.
Keep in mind, a Doji is not a guarantee of the next move; instead, it is a caution light. You should give it your attention, but also let price action and signals provide evidence of how you proceed with your trading.
Keep building your knowledge with our structured learning path. Each section builds upon the previous one.
This is the first section
You're at the beginning of your journey!
This is the last section
You've completed this course!
15 min
Reading time
Beginner
Difficulty
