
Select your preferred language
Language changes will apply immediately
Select your preferred language
Language changes will apply immediately
Double Tops and Bottoms
"Learn the mechanics of how double tops and bottoms work, how to find them on the charts, and how to leverage these powerful reversal patterns for your trading strategy."
Wikilix Team
Educational Content Team
As an example, do you ever view the market expanding with confidence, only to see the market reverse, not once, but twice at the same level? And then suddenly they allow the price to reverse and move in the opposite direction?
You are probably thinking to yourself, "I've seen this!" This is the work of double tops and bottoms, and while they are simple patterns, they do have tremendous power in identifying key reversal points in the market.
Knowing how to read these formations will benefit you immensely, whether it's your first day of trading or you want to enhance your technical analysis knowledge. By the time you finish reading this article, you will be clear as to how to identify, trade, and avoid getting caught in the common traps that often snag many trading beginners.
Double tops and bottoms are reversal chart patterns that signal a possible reversal in the current market trend:
• A double top pattern appears following an uptrend and indicates that the price may now start to trend downward.
• A double bottom pattern appears after a downtrend and indicates that the price may now be signalling an upward reversal.
Double tops and bottoms are like road signs for the market. They signal that buyers and sellers are battling for control, and it's equally likely that the next significant price move will go either direction.
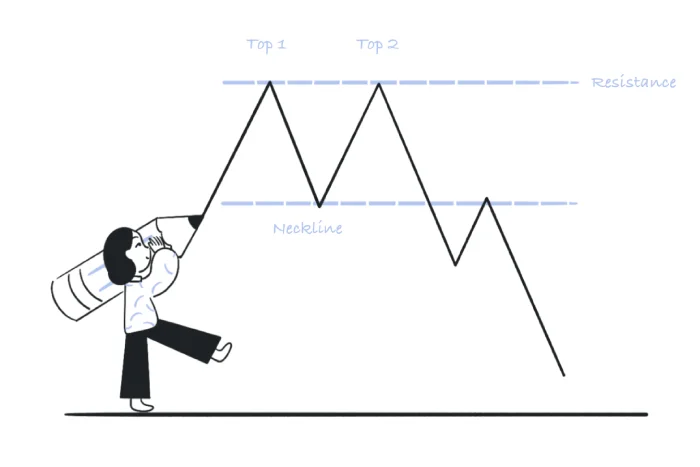
Double Top (Bearish Reversal)
• Appears after an extended uptrend.
• Price reaches the resistance level, pulls back, then retests the same level, which creates two peaks.• A critical level known as the neckline exists at the lower pivot between the peaks.
• Once the price moves below this neckline, the pattern is confirmed, and the price frequently follows with a move down.
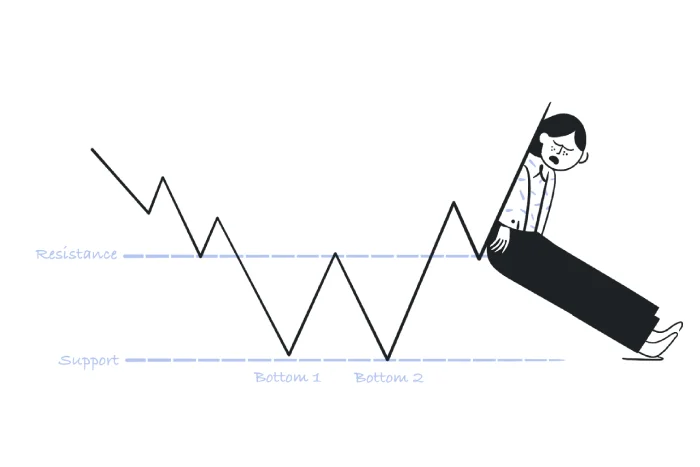
Double Bottom (Bullish Reversal)
• Occurs after a lengthy downtrend.
• Price will move down to a support area, rebound, and then come back to TEST the previous area again - this made two lows.
• Usually, the peak between the two lows is viewed as the neckline.
• When the price moves above the neckline, that is typically a signal for a new uptrend.
These patterns resemble the letters "M" in double tops and "W" in double bottoms, making them easy to remember.
1. Easy to Spot - The peaks and troughs are usually easy to see, even to beginner traders.
2. Defined Entry and Exit - The neckline gives a natural reference to enter and exit a trade.
3. Risk Management - Having a stop loss at a logical spot above the highs (double tops) and below the lows (double bottom) makes good sense.
4. Flexibility - Double tops and bottoms can be applied to any market, not just stocks or futures(NASDAQ) or options.
5. Potential for High Reward - If traded at the right time, they can have reasonable risk-to-reward ratios.
Recognising the double top and bottom takes practice and time, but here are the steps to follow: Find a Clear Prior Trend.
Both double tops are made after a strong uptrend, and double bottoms after a clear downtrend.
2. Confirm Two Similar Peaks or Troughs
The highs or lows do not have to be the same, but they must be close enough to display significant resistance or support.
3. Identify the Neckline
Draw a line between the lowest point between the two peaks (double top pattern) or the highest point between the two troughs (double bottom pattern).
4. Wait for a Breakout
Until price breaks the neckline and demonstrates a decisive break is present, do not consider a reversal.
5. Look At Volume
If there was an increased spike in Volume at the point of breakout that confirms the pattern, it adds credibility to the previous two peaks and troughs.
Step 1 — Spot The Setup
Locate a possible double top or bottom formation on your chart, and confirm if there was a strong preceding trend to the double top or double bottom.
Step 2 — Wait for Confirmation
You Never Want To Trade Expectation. Let Price Action confirm the breakout below the neckline.
Step 3 — Enter the Trade
• Double Top: Place a sell order at the market the moment price action closes below the neckline.
• Double Bottom: Place a buy order to open a long position the moment price action closes above the neckline.
Step 4 — Positioning A Stop-Loss
• Double Tops: A stop-loss is typically above the last peak.
• Double Bottoms: a stop-loss is typically the last low.
Step 5 — Target Profit Setting
A standard method of targeting profit is to measure the height of the formation (the distance between two peaks and the neckline) and project it from the breakout.
This gives you a logical, analytical-based target, and ultimately, less guessing.
Many newbie traders prematurely enter positions, and they are nowhere close to the breakout point. Price could continue its original trend without creating any reversal.
The best time to trade double tops or bottoms is to be in trends, not in sideways, choppy price action.
Double tops or bottoms will not look the same. This is practical for real-world trading. You will want to focus on the overall structure of price action forming the tops and bottoms, not simply Perfection.
Breakouts without any volume support typically fail more often than not.
5. Failing To Manage Your Risk.
A clearly defined risk will keep you in the stock market when a high-probability setup does not work right, over time
Pattern Type | Shape | Trend Context | Signal Type | Entry Trigger | Stop-Loss Placement |
Double Top | “M” | Uptrend | Bearish Reversal | Break below neckline | Above recent peak |
Double Bottom | “W” | Downtrend | Bullish Reversal | Break above neckline | Below recent low |
• Use multiple time frames: Use higher time frames to confirm the pattern so you are getting the strongest signal possible.
• Use indicators in conjunction: Use the RSI or MACD to confirm that divergences or momentum shifts agree with what you are seeing on the chart.
• Backtest your approach: Look at previous charts to help you build confidence and improve your plan.
• Be disciplined: Don’t let your emotions get in the way of your trading; allow the pattern to help you make a decision.
Double tops and double bottoms are one of the best chart patterns for identifying market reversals. They are easy to spot, give you a logical entry and exit, and give you good reward-to-risk when traded correctly.
That said, they are not infallible. Success will come when you combine these patterns with disciplined risk management, proper confirmation methods, and an awareness of market context.
With enough practice identifying the double top and double bottom formations, many traders will find that they are ultimately one of the most well-used weapons in their trading arsenal.
No one masters double tops and double bottoms overnight. But when you do, you will read market behaviour with clarity and confidence.
Keep building your knowledge with our structured learning path. Each section builds upon the previous one.
This is the first section
You're at the beginning of your journey!
This is the last section
You've completed this course!
15 min
Reading time
Beginner
Difficulty
