When investing in the forex market, your ability to analyse and read price charts is essential for making a profit. While price charts look like an endless amount of data, some of that data provides you with the clues you need on when to buy and sell. In a sea of perceived 'useful data', you must ask yourself ... What data is important? That is why indicators are essential. They are your competitive edge in the market. In this article, we will prove to you the vital indicators every forex trader knows. We should use this, whether you are a new trader just getting started or an experienced trader seeking to improve your methodology.
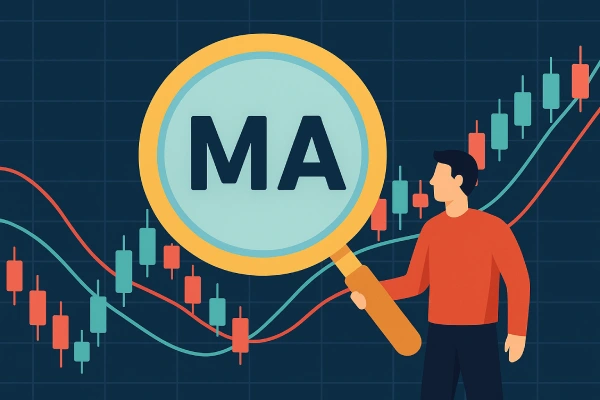
1. Moving Averages (MA)
Moving Averages, or MA, is the most rudimentary yet functional technique in technical analysis. In simple terms, MA is a tool for manipulating price data to find the direction of the trend better. As you'll discover, there are two main types of Moving Averages for forex traders: the Simple Moving Average (SMA) and the Exponential Moving Average (EMA). The most significant difference between the two is that SMA assigns the same value to all points on the data line. In contrast, EMA incorporates weighting changes to recent price data, giving it more significance than data from a longer time ago. This makes EMA responsive to recent price movements, while SMA is an equal representation of the gradient function of the data supplied.
Why is it essential:
• The trend in general (uptrend, downtrend, sideways)
• Filters out some of the market noise
• Commonly used for dynamic support and resistance
Traders will look at the 50 and 200-day moving averages to see long-term trends. They will also use crossover strategies (for example, short-term MA crossing above long-term MA) as a trend reversal signal.
2. Relative Strength Index (RSI)
The relative strength index measures the momentum of price movement. The RSI is an oscillator which ranges from 0 to 100 and is typically assigned to overbought or oversold conditions.
Why is it essential:
• RSI above 70 suggests the asset is overbought
• RSI below 30 indicates oversold.
• Helps traders call areas of interest for reverses or entry potential. RSI works best when used in conjunction with trend indicators such as moving averages. For example, if a currency pair under consideration is moving up and the RSI dips down to 30, this may present a buying opportunity.
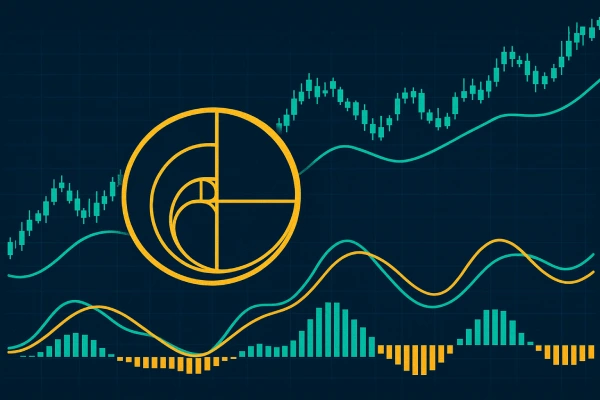
3. MACD (Moving Average Convergence Divergence)
MACD is a trend-following momentum indicator that shows the relationship between two moving averages of a security’s price. MACD consists of the MACD line, the signal line, and the histogram.
Why it matters:
• Provides clear signals for buy/sell opportunity
• Good for showing trend reversals and momentum
• Histogram helps to show the strength of the trend
A crossing of the MACD line above the signal line can be called a bullish signal, while a cross under can indicate the opposite.
4. Bollinger Bands
The three bands of Bollinger Bands consist of a mid-band (like a 20-day simple moving average) and the two outer bands represent standard deviations away from the mid-band. The bands expand and contract with volatility.
Why it matters:
• Measures volatility in the market
• Spotbreakout zones
• Staying with overbought and oversold levels
When the price hits the bands or moves outside the bands, it may indicate overbought or oversold. However, when in a strong trend, price can “ride” the band, so context is essential.
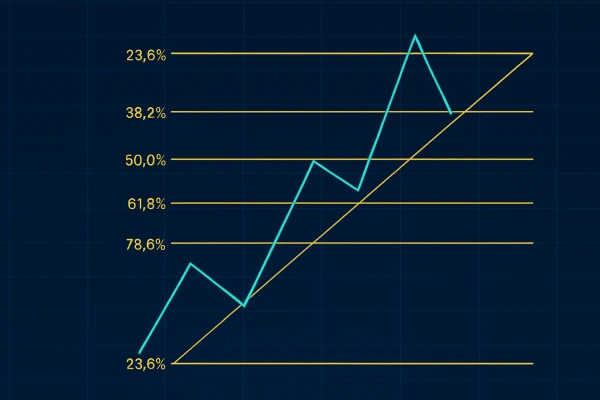
5. Fibonacci Retracement
Fibonacci retracement levels consist of horizontal lines that represent potential support and resistance levels. These levels are derived from the Fibonacci sequence, which forex traders frequently use.
Why it matters:
• Assist in spotting reversal levels
• Determine entry, stop-loss, and take profit points
• Fib works well with other Indicators
Common Fibonacci levels include 38.2%, 50%, and 61.8%. Traders often draw them from the swing high to swing low (or vice versa) to predict pullbacks within a trend.
6. Stochastic Oscillator
The stochastic oscillator takes a certain closing price of an asset and compares it against its range of prices over a defined period. The stochastic oscillator ranges from 0 to 100.
Why it can matter:
• Helps you identify overbought or oversold situations
• Provides buy and sell signals given %K and %D crossovers
• Can work in trending and ranging markets
It's most effective when used in conjunction with indicators that identify trend or momentum. For example, a bullish signal could occur when the %K line crosses above the %D line in an oversold situation.
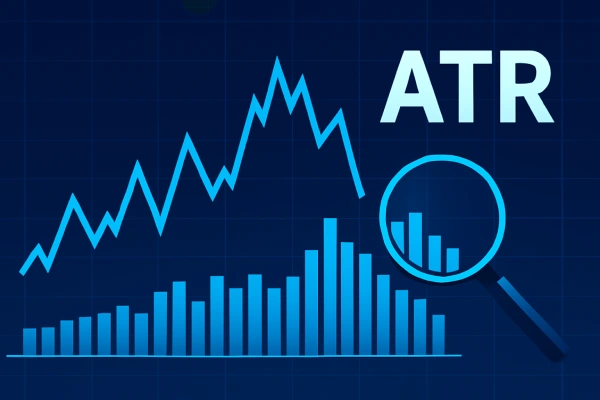
7. Average True Range (ATR)
ATR is merely a volatility indicator that gauges market volatility by slicing and dicing the entire range of an asset price for that period.
Why it can matter:
• Reflects overall market volatility
• Allows you to create stop loss levels
• Doesn't show direction but provides context
Higher ATR = Higher Volatility, so you should set wider stop-losses due to the increased volatility. Lower ATR = Low Volatility, indicating a potentially quiet market.
Putting It All Together
When these indicators are utilised individually, they can provide some context and insight, but the real power emerges when they are used in combination. For instance, the trader may utilise moving averages to identify the trend, use RSI to time entries and then use ATR to set the stop losses accordingly.
It's important to remember that no indicator is 100% accurate. They're not magic wands; they are a tool to help you assess your decisions. The best traders apply the indicator as part of a larger strategy, including risk management, discipline, and continuous learning.
Conclusion
Forex mastery is more than just indicators; it's about understanding how to combine indicators to paint a better, more complete understanding of the market. The indicators introduced in this content must be incorporated as parts of the larger puzzle. Learn them, practice using them, and develop them over time.
This will help you with your trading decisions, while you also become more confident in the ever-changing forex landscape.

