
Select your preferred language
Language changes will apply immediately
Select your preferred language
Language changes will apply immediately
Fibonacci Retracement Levels
"Understand Fibonacci retracement levels and learn how traders use them to identify potential support and resistance zones in financial markets and crypto trading."
Wikilix Team
Educational Content Team
Have you ever wondered how professional traders seem to have an idea of when the market might pause or reverse, as if by magic? There is no magic, but many traders use a fascinating mathematical concept, called Fibonacci retracement levels. Fibonacci levels offer potential zones where price may pull back before it resumes in the direction of the previous move.
We are going to define what Fibonacci retracements are, how they work to find price levels, and how you can profit from these Fibonacci retracements in stocks, forex, or crypto.
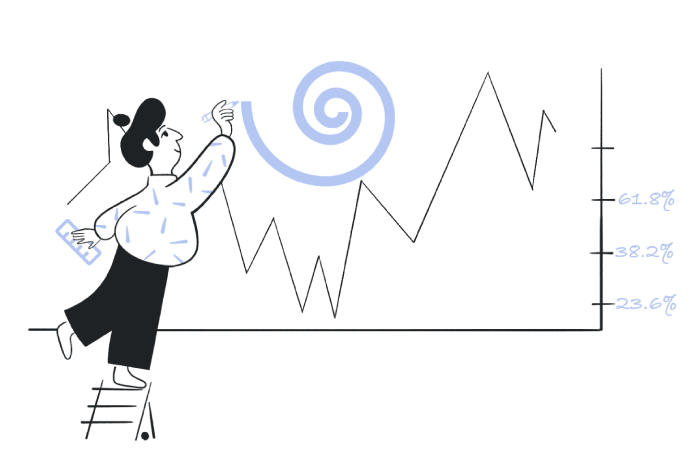
Fibonacci retracement levels are horizontal lines on the price chart that indicate potential areas of support and resistance.
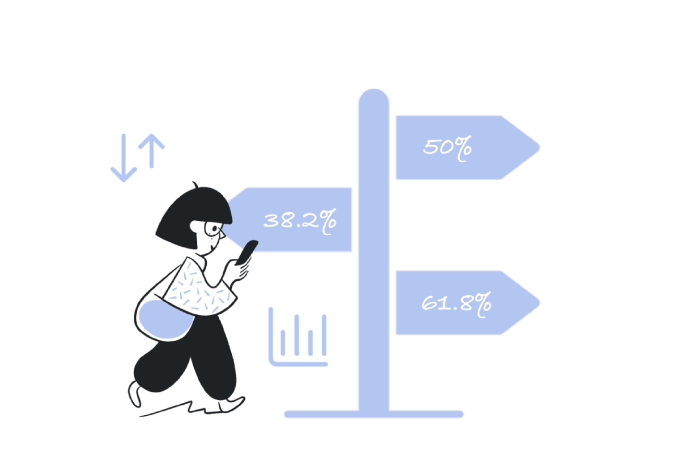
Fibonacci levels are based on key Fibonacci sequence percentages: 23.6%, 38.2%, 50%, 61.8%, 78.6%. When the market makes a significant price move up or down, it will typically retrace some of that move before continuing in the same direction. Fibonacci retracement levels allow traders to identify potential retracement levels, making them an excellent resource for planning entries, exits, and stop loss levels.
These Fibonacci levels are derived from the Fibonacci sequence, which is a series of numbers that starts at 0 and 1 and continues as every number is equal to the sum of the previous two: 0, 1, 1, 2, 3, 5, 8, 13, 21, 34,...
What is interesting about this sequence of numbers is the relationships. As the progression of the sequence moves, the ratio of the number to the previous number approaches a ratio of 1.618, which is referred to as the golden ratio.
Ratios derived from this relationship, such as 38.2% and 61.8%, are the very basis of Fibonacci retracement levels. Traders realized that markets frequently react to these ratios, thus making these retracements a good technique for technical analysis.
Fibonacci retracements are easy to plot, especially on the various trading platforms today:
1. Identify the Trend: Determine if the market is trending up or down.
2. Identify the Swing High and Swing Low: Select the most recent swing high and swing low (a significant high and low on the chart).
3. Plot the Retracement Tool: For an uptrend, the swing low is the starting point and the swing high is the finalized designated point, and for the opposite in a downtrend.
4. Look at the levels: The software will automatically draw Fibonacci percentages between these two levels, while providing you with a visual reference about the potential retracement areas.
While the Fibonacci levels do not give you exact price reversals, they give you areas where the price may react.
Fibonacci retracement levels are popular because they align with how we observe market behavior. Price action will rarely go in a straight line. Price will trend, pause, pull back, and then continue. Often, these pauses will happen around the Fibonacci ratios, and using them within your trading plan can help you:
• Identify entry points for a trade after a pullback
• Determine logical stop losses based on the Fibonacci level beyond critical levels
• Anchor take profits to price areas based on the price reaction
Keep in mind that Fibonacci levels should not be relied upon for notional guarantees, and instead be used with a retracement trading plan, but do significantly provide key observations for confirmation.
Using Fibonacci levels on their own can be dangerous because markets can sometimes ignore them. However, successful traders usually look for confluence (multiple indicators pointing to the same level). For example:
• A Fibonacci retracement intersects with a moving average.
• A candlestick reversal is forming just outside a Fibonacci zone.
• You see a significant volume increase at a retracement level.
• You have an indicator like RSI or MACD showing confirmation of a possible reversal, based on a Fibonacci retracement.
The more signals there are at one price zone, the better chance the market will react.
Let's go through a simple step-by-step way to use Fibonacci retracements.
a. Trading Pullbacks in a Uptrend
• Identify a strong move upward.
• Use the Fibonacci tool to find the retracement levels using the swing low to swing high level.
• Watch the 38.2% and 61.8% levels closely because these levels will typically act as strong support in an uptrend.
• Wait for confirmation before you enter a trade, such as a candlestick pattern at one of the Fibs levels.
b. Trading Rallies in a Downtrend
• Identify a strong downward move.
• Draw Fibonacci levels using the swing high to swing low level.
• Watch for retracements up to the 50% or 61.8% levels, which could act as resistance.
• Enter a trade when price action confirms continuation of the downtrend.
While retracements help you anticipate where pullbacks may stop, Fibonacci extensions project where the next move might go. Common extension levels are 127.2%, 161.8%, and 261.8%.
As an example, after a 50% retracement, traders might target the commonly used 161.8% extension as the point where they take profit. Fibonacci extensions recommend using them in conjunction with retracement levels and other indicators.
Strengths
• Simple and visual: They are intuitive and rapid to plot.
• Widely used: Popularity can lead to self-reinforcing usage by multiple traders reacting to similar areas.
• Flexible: They can be applied in every market to every timeframe (crypto, forex, stocks, commodities, etc.).
Limitations
• Subjective application: Traders will select different swing points, leading to different results.
• No guarantee: Price does not always react to Fibonacci levels, most notably during strong trends and during news announcements.
• Best used in conjunction: Fibonacci retracement levels are most effective in combination with other analysis methods.
While all technical analysis trading tools are limited in a fast-moving market, Fibonacci retracement levels are one of the most popular tools in cryptocurrency trading. In Bitcoin, Ethereum, and other altcoins, prices can experience sharp ups and downs with retracements occurring within Bitcoin's pullback. Using Fibonacci retracement levels to identify potential pullback opportunities could be helpful for traders.
For example, it's not uncommon for the price to move sharply up during a Bitcoin rally, only to retrace a few hours or days later, typically around the 38.2% or 61.8% Fibonacci levels, before continuing upward. In the volatile cryptocurrency world, using Fibonacci levels in combination with volume and candlestick analysis can further tighten entry/exit points.
Fibonacci retracement levels are one of the most straightforward yet most versatile tools in technical analysis. They combine mathematical ideas with real-world trading strategy, helping you logically identify turning points where the price could be pausing, changing direction, or accelerating.
That said, Fibonacci retracements aren't a crystal ball. Your success will come from confirmation, discipline, and effective risk management. By using Fibonacci retracement levels in conjunction with other technical indicators and practicing good trading discipline & planning, you can easily turn these simple ratios into your best friend trading the markets today.
Keep building your knowledge with our structured learning path. Each section builds upon the previous one.
This is the first section
You're at the beginning of your journey!
This is the last section
You've completed this course!
12 min
Reading time
Beginner
Difficulty
