
Select your preferred language
Language changes will apply immediately
Select your preferred language
Language changes will apply immediately
Mastering the Head and Shoulders Pattern in Trading
"Find out what the head and shoulders pattern is, how to spot it, and how traders utilise this dynamic reversal signal for fading directional movement with high probability."
Wikilix Team
Educational Content Team
Have you ever gotten the sense that a major turn is occurring in the Market, but are unable to name it? Then, like lightning, the price quickly pivots behaviour, leaving you confused as to what just happened. That feeling—where the Market is telling you, 'something is changing'—is almost always where the Head and Shoulders pattern is surfacing.
It's one of those rare setups that seem intuitive, once you learn to identify it. Stick with me for the next few minutes, and I will explain how to recognise it, how to trade for it and how to use it effectively.
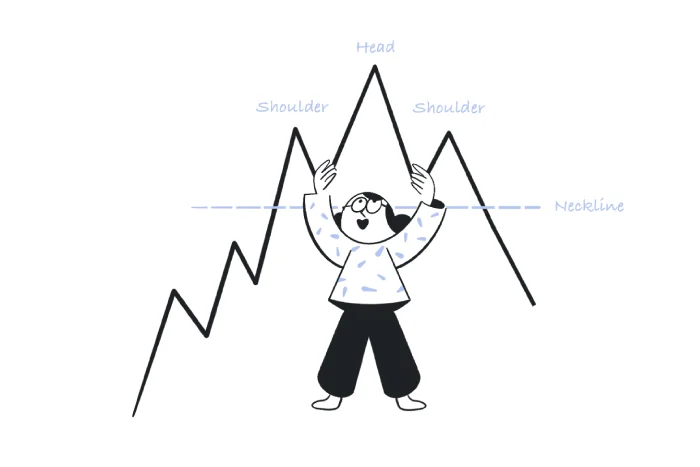
In basic terms, the Head and Shoulders pattern is a reversal formation that is very well-defined and indicates the likelihood of a shift from bullish to bearish momentum. The Pattern consists of 3 peaks:
• Left Shoulder: lead up, lower reversal
• Head: higher peak, obvious high point
• Right Shoulder: modest peak height similar to the left peak, indicating dwindling bullish movement
Usually, the price will break down underneath a trendline drawn through the lows during the formation of the Head and Shoulders (the neckline). After the break, the Head and Shoulders pattern typically marks a definitive change in trend from bullish to bearish.
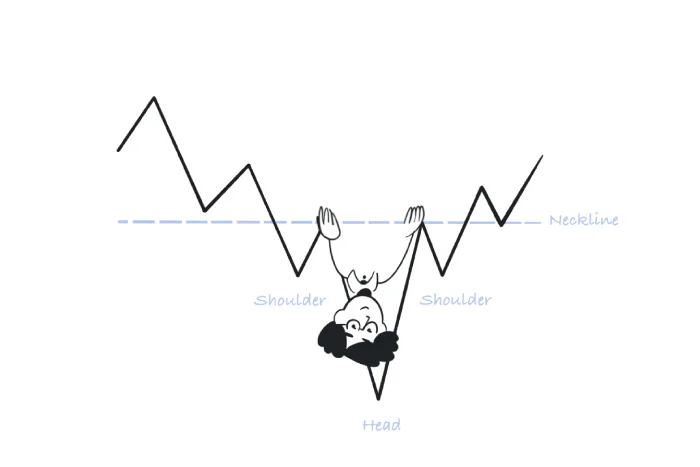
There is also an inverse version—Inverse Head and Shoulders—that works in the opposite principle of bullish to bearish: ideal for bearish reversals.
• Simple Structure - The shape of the Pattern is clear and identifiable, making it easy for traders to spot on almost any chart.
• Specific Entry and Exit Zones - the neckline and peaks help traders find reasonable entry points, as well as tight stop losses (landmarks).
• Uniqueness (market-wise) - From stocks to commodities to forex to crypto, this Pattern is applicable across the board.
• Fun and Simple to Measure Targets - You can measure movement simply by projecting the distance between the head and neckline down the breakout line.
Left Shoulder
The Market creates an upside push and makes a peak. Afterwards, there is a pullback, or retracement, down (often due to profit-taking or just minor news).
Head
After the pullback, the next push upward surpasses the previous peak; however, the rally sees heavy resistance and arches higher than the left shoulder (forming an impressive top).
Right Shoulder
Final rally fails to push above the head level highs. The final peak will often be right back near the same price point as the left shoulder high (indicating the bullish conviction is now fading).
Drawing the Neckline
You will have to connect the two intermediate low points (dips) between the two shoulders and head. This horizontal line or angle represents your trigger zone.
5. Breakout and Follow Through
Once the price action closes below the neckline, you will have confirmation. A price movement down can return some heavy volume, which should make you feel great about the reversal.
You should first confirm there is an established uptrend, and that you see the left shoulder, head, and right shoulder clearly forming in each of the trades.
You will want to use whatever your chosen diagrams or templates allow to draw your best straight lines to connect the two dips. You can have minor visual differences, but it should line up, it's truly close.
You will want to have patience here—do not enter short (or long on inverse) unless the price has closed convincingly below (or above) the neckline.
For a standard pattern, your stop should be placed adjacent and just above the right shoulder; alternatively, it should be placed below the price at the right shoulder when trading the inverse.
Measure the vertical distance from the top of the head to the neckline. From the price action breakout, project the distance from the breakout price to determine your target.
Consider moving your stops to breakeven when the price action reaches or is near half of the anticipated move, and consider this in a piece.
• Early Entries - Entering before the Market has broken out and is necessarily subject to false signals or whipsaw moves.
• Forcing symmetry - The two shoulders do not need to match exactly. They need to show that buying is weakening..
• Ignoring the trend - These tend to be the most reliable after a well-established trend - NOT a sideways or erratic market.
• Ignoring volume - A breakout is less meaningful if volume does not conform. Look for at least a modest uptick in volume; otherwise, you can wait for a new setup that may be tradeable.
• Ignoring a risk management plan - As with all patterns, regardless of reliability, they can and will fail. It is your responsibility to have a disciplined stop-loss plan.
The inverse head and shoulders pattern is simply the complete opposite of the regular head and shoulders:
• A downtrend, leading into a low (Left Shoulder)
• Then a lower low (Head)
• Then a higher low (Right Shoulder)
• Break above the neckline, anticipating bullish market reversal.
The inverse head and shoulders is a powerful mirror setup that provides valuable insight into when a market is poised to bounce.
• Use higher timeframes to analyse trends and patterns. Identify patterns on daily or weekly charts, not just short intraday timeframes.
• Work with other indicators. In addition to losing potential trades biased by the divergence on indicators like RSI or MACD, it can also provide further confirmation of the structure.
• Back-test your trading plan. Back-testing with historical charts is a great way to practice not only your recognition rules but also your rules for identifying and entering trades, thereby building your confidence and discipline.
• Stay emotionally detached. Lastly, trust the structure, not your gut, regardless of the structure you trade, especially when managing your trade after a breakout and in the Market.
• Stay flexible to the phase of the Market. Shapes are formed under certain conditions, as long as they look close enough to a general shape but not perfect.
Pattern Type | Appearance | Trend Direction | Entry Signal | Stop-Loss Placement |
Head and Shoulders | “∩” shape | Uptrend | Break below neckline | Above right shoulder |
Inverse Head and Shoulders | “∪” shape | Downtrend | Break above neckline | Below right shoulder |
The Head and Shoulders pattern is one of the most sophisticated instruments we have in technical analysis, simple to learn, measurable and predictive. It is not mathematical wizardry—just solid structure and trading logic. When identified and applied consistently and predictably, it enables traders to anticipate trend developments clearly.
However, it should always be paired with sound risk management, appropriate confirmation, and a clear comprehension of market momentum. Over time, head and shoulders will feel less technical and more intuitive, like a sixth sense shared among experienced traders.
So, go ahead and practice spotting it, develop a backtest process that suits you and trade it with confidence. Then, when the next "head" is within the price charts and a neckline break occurs, you will be well aware of what to do.
Keep building your knowledge with our structured learning path. Each section builds upon the previous one.
This is the first section
You're at the beginning of your journey!
This is the last section
You've completed this course!
15 min
Reading time
Beginner
Difficulty
