
Beginner
How to Interpret Japanese Candlestick Patterns
How to Interpret Japanese Candlestick Patterns
"Unlock the secrets behind Japanese candlestick patterns. Learn how to read and interpret them to spot market trends, reversals, and make smarter trading decisions.""
Wikilix Team
Educational Content Team
July 28, 2025
15 min
Reading time
Beginner
Difficulty
#learningwave#RedingJapaneseCandelestickPatterns#forex

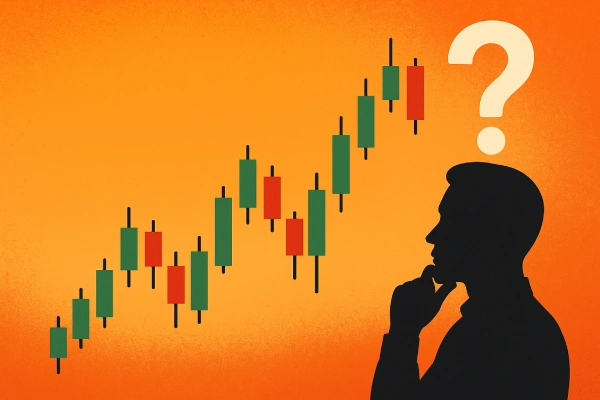
Have you ever looked at a price chart and wondered what all the colorful bars mean? To the untrained eye, candlestick charts may look like variations of abstract shapes, but to the skilled trader, they tell interconnected tales derived from market psychology, trader feelings, and prices. Japanese candlestick patterns are one of the most potent systems in the arsenal of most traders. If you want to make higher-quality trading decisions and comprehend what price action is not saying, knowing how to read candlesticks is not helpful; it is crucial. Let's break them down piece by piece and learn how to derive insight from each candle.
What are Japanese Candlesticks?
Japanese candlesticks are a type of price chart employed in technical analysis. As a charting tool, they were used in 18th-century Japan by a group of rice traders long before modern stock markets existed. Each candlestick represents the price action of an asset over a specific period (e.g., one minute, one hour, one day, etc.). Each candle has four components in this example:
Open: The price at the start of the period.
Close: The price at the end of the period.
High: The highest price during that time.
Low: The lowest price at that time.
The body (the thicker part) is the difference between the open and closed. The wicks or shadows (the thin lines) are the high and low prices. A green (or white) candle usually signifies the price closed above the opening price, while a red (or black) candle signifies the price closed lower than it opened.
Benefits of Candlestick Patterns
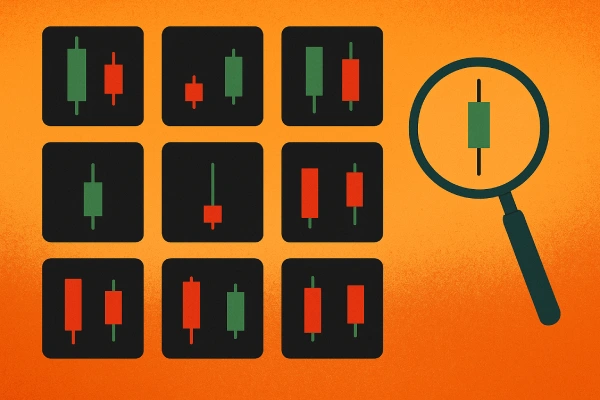
While a single candle provides valuable information, candlestick patterns — sequences of two or more candles — signal direction as the market moves. Candlestick patterns can give traders the ability to recognize:
• Potential reversals,
• Continuations,
• Indecision or volatility,
• Strong areas of support and resistance.
Reading candlestick patterns allows traders to predict where the price may go before it occurs, rather than after.
Types of Candlestick Patterns
Candlestick patterns can fall into three categories: 1. Bullish Reversal Patterns. This suggests that the downward trend is coming to an end, and the price may be ready to move higher. 2. Bearish Reversal Patterns This signifies that the upward trend already established could be losing momentum and could reverse downward. 3. Continuation and Indecision Patterns These types of patterns either suggest that the trend that is currently present could continue or that the market is indecisive and unsure of the next move.
📈 Common Bullish Candlestick Patterns:
1. Hammer
small body at the top, long lower wick - Buyers come back in after sellers move price down - possible reversal.
2. Bullish Engulfing
a large green candle that fully engulfs the prior red candle - a Strong signal of buyer control.
3. Piercing Line
first candle is a red candle, followed by a green candle that closes above the midpoint of the first - suggests a possible trend reversal to the upside.
4. Morning Star
three candles are long red, small-bodied (gap down), and long green - Strong bullish reversal candle pattern.
5. Three White Soldiers
three consecutive long green candles - indicates strong and steady buying pressure.
6. A Doji (After a downtrend)
has very little to no real body - shows indecision as to market direction; however, if there is a green candle after it can indicate a possible bullish reversal.
📉 Common Bearish Candlestick Patterns:
1. Hanging Man
- Small body on top, longer lower wick
- Appears after an uptrend - possibly bearish reversal.
2. Bearish Engulfing
- Large red candle fully engulfing previous green candle
- Sellers are taking control.
3. Dark Cloud Cover
- Green candle, followed by a red candle that opens higher but closes below the mid-point of the first
- This is an early warning for some bearish pressure.
4. Evening Star
- Three candles: green, small-bodied candle (gap up), red
- Strong reversal down.
5. Three Black Crows
- Three long red candles in a row
- Sustained selling momentum.
6. Doji (at the top)
- Small or no body
- While technically neutral, some hesitation in the market at a high level; it is likely to revert down if confirmed by a red candle.
Indecision and Continuation Patterns
· Doji A doji has almost no body - the open and close prices are very close or the same. A doji indicates indecision in the market. Interpretation: Neither bulls nor bears have a firm grip on the market - wait for confirmation.
· Spinning Top A spinning top pattern has a petite body with long wicks on either side, signaling a point of balance and uncertainty. Interpretation: This could indicate either a pause in the trend or a potential reversal; we need to consider the context to determine the correct interpretation.
· Inside Bar / Harami An inside bar or harami is a small candle that is entirely inside the body of the previous candle. An inside bar pattern could be bullish or bearish, depending on the context. Interpretation: The market is in a consolidation phase, and a subsequent breakout bar may be expected.
How to Read Patterns Effectively
Reading candlestick patterns effectively is more than simply memorizing shapes. You should know the context surrounding the candlestick:
Location is important
A hammer in an uptrend signifies nothing.
A doji sitting at a strong level of support is much more meaningful than an indecision candle in the middle of a range.
Confirmation is Important
•Trading based on one candle is not smart.
• You should look for a second candle or volume confirmation to support the signal.
Use in Conjunction with Other Tools
• Support and resistance areas
• Moving Averages
• Volume indicators
• Trendlines and Fibonacci levels. The more evidence you have, the better your setup.

Mistakes to Avoid When Reading Candlestick Patterns
Even professional traders get things wrong from time to time when reading a pattern. Here are several traps to avoid:
❌ Ignoring Timeframes: A bearish pattern on a 5-minute chart may mean nothing in a daily chart.
❌ Forcing the Pattern: Just because you want a signal does not give you the right to "see" a pattern if there is not one.
❌ Skipping Confirmation: Jumping in without waiting for confirmation generally leads to false signals.
❌ Ignoring Market Context: In a super strong bump market, the bearish signal may be a trap.
Candlestick Patterns in Action
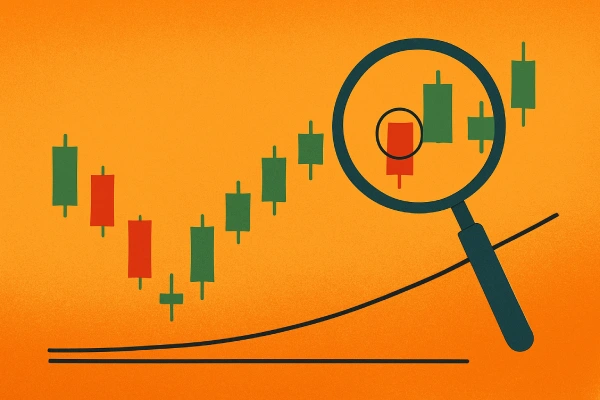
Example: Suppose you are analyzing the USD/JPY chart on the 1-hour timeframe. The analysis follows:
You see a strong downtrend, then a long red candle. Then a hammer forms at a tested support level. The next candle closes above the body of the Hammer. • Below is how you may interpret and react:
✅ Entry: Execute a buy trade once the follow-through bullish candle appears.
✅ Stop Loss: Just beneath the Hammer's wick (the low point).
✅ Take Profit: Aim for the next actionable resistance level above.
This setup combines pattern, confirmation, and context for a high-probability trade.
Conclusion
Japanese candlestick patterns are more than just cool shapes—they are visual snapshots of trader behavior, psychology, and momentum. If read in the proper context, along with other factors, they can give you a significant advantage in the market. We do not want you to memorize hundreds of patterns; instead, we want you to understand what they represent and how they behave in different situations. Get on real charts, pay attention to how patterns respond to key levels, and always wait for confirmation!
Eventually, reading candlestick patterns will become natural. And once it clicks, you'll stop guessing—and start trading with absolute confidence.
Continue Learning
What's Next?
Keep building your knowledge with our structured learning path. Each section builds upon the previous one.
This is the first section
You're at the beginning of your journey!
This is the last section
You've completed this course!