
Select your preferred language
Language changes will apply immediately
Select your preferred language
Language changes will apply immediately
Ichimoku Cloud: Complete Guide & Trading Strategies
"Discover what the Ichimoku Cloud is, how it works, and how to use this versatile indicator to identify trends, spot reversals, and make better trading decisions."
Wikilix Team
Educational Content Team
Could you have a way of wrapping your price chart in a shaded forecast? Not just for the current price, but also for potential price shifts to come? All without clutter. That's the Ichimoku Cloud. It's more than just an indicator; it's more like a landscape view of the market.
It shows you where momentum is flowing, where potential resistance is likely to be, and where possible support to catch a fall is. Stay with me, because by the time you finish this guide, you're going to discover how this excellent indicator can bring clarity and confidence to your trading decisions.
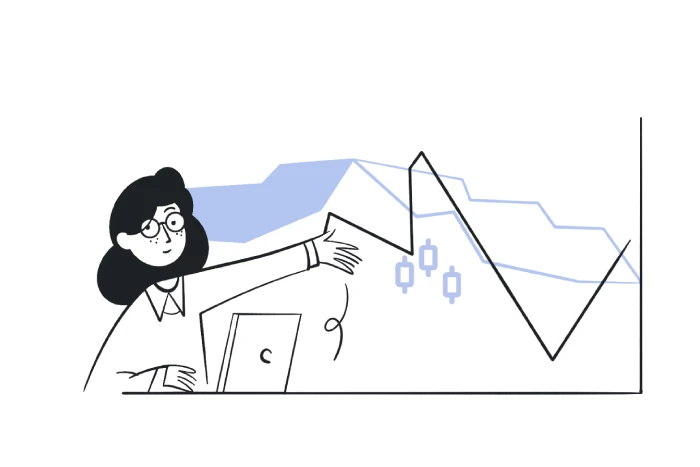
The Ichimoku Cloud, aka Ichimoku Kinko Hyo, is a complete technical indicator that integrates trend, momentum, and support-resistance into one visualization. It's composed of five different lines that form a cloud, also known as the Kumo, and these elements interact with each other to help provide a view of price behavior over many different time frames.
Here are the basic ingredients:
• Tenkan-sen (Conversion Line) — The average high and low price over the last nine periods. You can think of it like a short-term trend line.
• Kijun-sen (Base Line) —Similar to Tenkan-sen, but over 26 periods, providing a medium-term trend.
• Senkou Span A (Leading Span A) — The midpoint between the Tenkan and Kijun, plotted 26 periods into the future. One cloud boundary.• Senkou Span B (leading span B) - the average of the highest high and lowest low for the past 52 periods is plotted for the current price action (also plotted 26 bars ahead).
• Chikou Span (lagging span) - this line is the current price action, plotted at the position of the current bar, meaning you can see the price today relative to the same time period 26 periods back.
With these lines plotted, they create the Kumo, known as the cloud, which typically will signal a trend and possible reversal.
• When Leading Span A is above Leading Span B, the cloud is typically shaded with one color—bullish.
• When the order is altered, there is another color present—suggesting bearish pressure.
• Above the cloud: The market is typically in a bullish trend.
• Below the cloud: Bearish sentiment is typically present.
• Within the cloud: Suggests indecision or a market in transition—best to wait and/or trade cautiously.
• When the Conversion line crosses above the Base Line, and the price sits above the cloud— this is a bullish signal.
• Similarly, when the Conversion line crosses below the Base Line and price lies below the cloud, this could be an emerging bearish influence.
If the Lagging Span (Chikou) is above the price action from 26 periods back, trend momentum is supporting the bullish trend; conversely, if the Lagging Span is below, then some downside momentum may be remaining.
The eight, twenty-six, and fifty-two basis formula found in the ichimoku calculation originates from traditional Japanese cartography (4 days of an average work week on a daily chart was represented in days six, twelve, and twenty-four, etc.). You will now find the Ichimoku average in use, though you can tailor it to your own trading rhythm. The shorter the time period, the quicker the signals, with longer averaging, the smoother and slower the reactions.
Determine when the price breaks above the cloud. Confirm that the Conversion Line is above the Base Line and, at a minimum, the bullish color is displayed in the cloud. Use the Base Line as a trailing stop, or a filter for the trend potential.
When the price breaks into or out of the cloud, consider using different time frames to determine whether we're starting a new trend or reversing one. Consider confirmation from volume or other momentum-based indicators to confirm the cloud transition.
Cloud boundaries function as a moving price area. In an uptrend, the upper edge should provide support on the retracements, and conversely, the lower edge should function as resistance in a downtrend.
Pros:
• Integrates trend, momentum, and support/resistance information neatly in visual form.
• Trend indications provide the ability to determine if we are aligned with the trend, while providing the ability to reduce false entry signals.
• Works over multiple time frames and provides versatility to plot trades from fast trades and longer-term perspectives visually.
Cons:
• There can be lag with the boundary cloud areas after fast moves, and therefore, the signals are not always early.
• Price whipsaws can occur within the cloud area, creating noise.
• Works best with other filters, so do not use it in exclusion.
Ichimoku provides a unique value proposition to traders: it simplifies complexity. Essentially, it compresses important trend information and market context into a visual "cloud" area that is easy to interpret. Using Ichimoku, traders are not left to interpret multiple tools to provide a big picture tediously: where is the trend, where is the momentum, and historically how did price interact with itself.
Here is your abbreviated or condensed playbook:
• Cloud above price? = Bearish space.
• Cloud below price? = possible bullish area.
• Cloud edge is crossed with lines either in sync above or below? = trend becomes potentially accredited.
• Chikou is supporting direction with respect to historical price? = momentum confirmation.
• Cloud edge = dynamic boundaries to monitor for entries and exits.
Customize the indicator to your liking by integrating the Time Frame of your trading plan, patience, and discipline, allowing you to form it into more than an indicator. After some practice, you will observe the Ichimoku cloud indicator as just a visual guide that brings clarification, context, and direction into your spatial navigation.
Keep building your knowledge with our structured learning path. Each section builds upon the previous one.
This is the first section
You're at the beginning of your journey!
This is the last section
You've completed this course!
10 min
Reading time
Beginner
Difficulty
