
Select your preferred language
Language changes will apply immediately
Select your preferred language
Language changes will apply immediately
Introduction to Chart Patterns
"Learn about chart patterns basics, types of chart patterns, and how to use them in technical analysis to predict market direction like a pro—a guide for beginners and traders."
Wikilix Team
Educational Content Team
Imagine if you could acknowledge the faint scars of market psychology—seeing past the price and feeling the psychological tug between fear and greed. This is the beauty of chart patterns, and whether you are just getting started or already have some trading experience, understanding chart patterns is like developing a sixth sense of market behaviour.
For the next few minutes, join me as I give you a focused and confident understanding of chart patterns that traders use every day.
Chart Patterns are visual formations created by price movements charted on a chart. You can think of them as signals produced by the runs of market participants, when supply and demand meet at a distance to create distinct shapes of something recognisable.
These shapes can give insight into whether the existing trend is likely to continue or reverse, such as with Supply & Demand zones, lows or highs formed in price action or a complex system of chart surveillance. After all, it is all just patterns that the market has made previously over time.
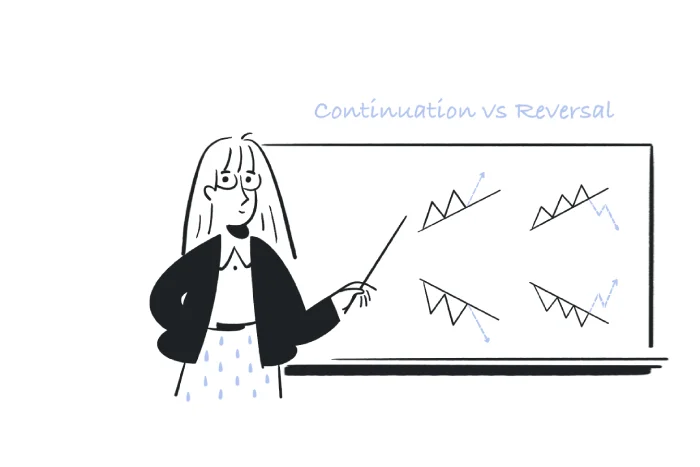
In essence, chart patterns can be divided into two primary categories:
• Reversal Patterns: Indicate a potential change in the current trend, such as Head & Shoulders, Double Tops/Bottoms, and Cups & Handles;
• Continuation Patterns: Indicate the trend is taking a break before continuing, such as Triangles. Some patterns - we may call them wedges or triangles - can be either, typically depending on market context, and your experience regarding how they break.
Head and Shoulders
Classic reversal pattern, suggesting the price will create three peaks, one middle peak (the head) that is higher than the other two peaks (the shoulders) on either side. A usual break of the neckline will confirm a reversal of the trend.
Double tops - a market whereby it has created two peaks, without breaking resistance.
Double bottoms - a market pattern characterised by the creation of two bottoms without breaking support. Typically, you will require a confirmation of the reversal above the breakout as well.
Triangles
Often, triangles will crossover as continuation patterns - when the price action gets narrow:
• Ascending Triangle: flat top, rising bottom.
• Descending Triangle: flat bottom, declining top
• Symmetrical Triangle: lines are converging on each aligned side.
Flags and Pennants - After a largish push/pull movement through time, the market will seem to pause and consolidate:
• Flag - a smaller rectangle formation
• Pennant - a smaller triangle-like formation
Usually, they will travel in the direction of the first movement.
Cup and Handle: It resembles a "u" shape, transitioning into a slight downward slope, characteristic of the cup and handle pattern. A bullish continuation pattern often results in an upward breakaway.
1. Patterns become more reliable subject to a clear preceding trend.
2. Support and resistance lines with trend lines create a visual picture of a pattern.
3. The pattern will have a clear structure, will touch the first and second support/resistance points on multiple occasions. This would be a good sign.
4. Wait for a breakout. Do not risk entering a trade without a breakout. A much higher risk would be there if no breakout confirmation were present.
5. Often, it is a good sign on breakouts if volume appears alongside it.
6. You are responsible for knowing your risk and where to put a stop price, to begin with. Good practice for risk management involves recognising that patterns may fail or false breakouts can occur, which can lead to opportunity costs due to not implementing limits for potential risks, ultimately affecting the results.
Chart patterns occupy the nexus of price action and psychology. Patterns cataclysm all of the thoughts and actions of all traders engaged in the price movement and classify them into a geologic snapshot of price action.
When traders see familiar patterns emerge in their surrounding world, they can discern what is occurring in the price movement, alert themselves to possible outcomes, and set themselves up to have tighter or looser entries, exits, and position/risk management. Patterns will become second nature in your process, and you will be less stressed and more consistent with the most current prevalent action for yourself, in the market.
• Think some patterns are not there - it is essential to remember patterns are open to the subjectivity of the evaluator, I suggest adhering to a disciplined pattern criteria.
• Failing to consider context - strong directional trends will behave differently from broader weak directional trends. Just because it is a double top does not imply contextual relevancy for concluding patterns that represent those characteristics.
• Failing to avoid false breakouts, for example, a head fake, once the same patterns have been successfully identified earlier. Avoid feeding off pre-conceived projections from previous trades that are false breakouts; instead, wait for price confirmation in direction and close with volume.
• Have peace of mind - don't skip on risk management, even good patterns may fail or false breakouts actually take place - the higher you can mitigate those probabilities to take place by utilising multiple stop losses.
Tip: Regularly review your trades, both successful and unsuccessful, as an exercise to gain a deeper understanding of pattern dynamics.
Patterns are not magic; they are representations of the logical patterns left behind in the pain of the struggle against buyers and against sellers. Once you can determine a state of play, either a reversal or continuation pattern, you will possess a valuable tool that has consistently demonstrated its ability to predict most market price movements.
Lastly, please remember to be patient, clear-minded, and disciplined. This involves being able to determine the correct endings or patterns, recognise the pattern posture, identify the breakout opportunity, and risk the right amount of cash. It is not a secret that you want to practice your skills continually.
Only the practice of completing repetitive, fulfilling actions can elicit the 'feel' you need to develop over time, ultimately creating a good trader from a great one.
Keep building your knowledge with our structured learning path. Each section builds upon the previous one.
This is the first section
You're at the beginning of your journey!
This is the last section
You've completed this course!
12 min
Reading time
Beginner
Difficulty
