
Select your preferred language
Language changes will apply immediately
Select your preferred language
Language changes will apply immediately
Introduction to Moving Averages
"Understand the basic principles of moving averages, how they work, and how traders use them to identify trends, identify their entries and exits, and adjust their trading plans."
Wikilix Team
Educational Content Team
Have you ever looked at a price chart and wondered how professional traders seem to have a knack for knowing where the market is going? Indeed, we cannot forecast price movements, but traders use various tools to smooth out price moves and identify trends. One practical and consistent tool present in technical analysis is the moving average.
Moving averages help to smooth out price volatility, which helps to reveal the underlying trend as well as potential entry and exit points. We will examine what moving averages are, how they function, and how traders can apply moving average techniques effectively across various markets and time frames. This should give you a complete view. Whatever your level of experience, this article should help you get a positive perspective.
Moving averages (MA) are a technical indicator that represents the average price of an asset over a period. It does this by averaging price points over a designated time frame. This helps traders smooth out noise and focus on more visible trends.
The formula is simple: the trader takes the closing prices over a defined number of periods, adds them together, and divides by that number. The average price calculated becomes a line on the price chart that is calculated on each new time unit and is updated as each data point is added, hence called a “moving” average.

There are two main types of moving averages, which many traders use:
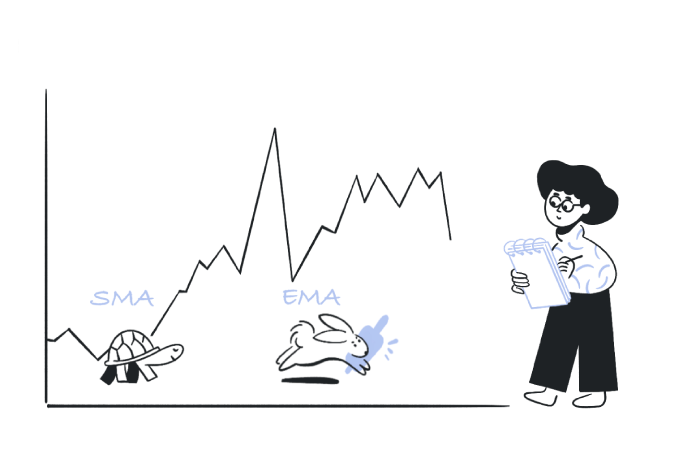
a.Simple Moving Average (SMA)
• Determined by summing prices over a designated period divided by the number of periods.
• Generally smooths out price action.
• Works best in trending and stable markets, responds much slower to rapid price changes.
b. Exponential Moving Average (EMA)
• Places greater importance on more recent pricing data.
• Reacting quicker to volatility than the SMA.
• A preferred indicator for short-term traders to identify fast changes in momentum.
They each have advantages. While SMAs may be the best for identifying long-term trends, EMAs may be more suitable for short-term price changes.
Moving averages are primarily used to determine if an uptrend, downtrend, or sideways market exists:
• When price remains above the moving average, the market is probably in an uptrend.
• When the price stays below the moving average, the market is usually in a downtrend.
• When the price moves up and down in proximity to the moving average, the market may be range-bound.
Traders will typically use different periods - for example, 50-day and 200-day moving averages - to differentiate between short-term and long-term trends.
One of the most popularly used strategies combines moving average crosses and signals. A moving average cross occurs when two moving averages of different lengths cross each other. This is typically beneficial to use as trend changes exist:
• Golden Crosses- This happens when a short-term moving average (50-day) crosses a long-term moving average (200-day), seen as a bullish signal.• Death Cross: The occurrence when a short-term MA crosses below a long-term MA and signals what could be a bearish movement.
Crossovers are popular because they offer straightforward, rule-based triggers for entry and exit.
Moving averages act differently in different timeframes.
• Short-term averages (9, 20, or 21 MA): These are the best for scalpers and day traders seeking quick price movement.
• Medium-term averages (50 or 100 MA): These are good for swing traders looking for intermediate trend tracking.
• Long-term averages (200 MA): These are great for investors seeking longer-term direction in the market.
Use of multiple timeframes will allow traders to confirm signals and avoid fake setups.
Moving averages can also imply dynamic support or resistance levels. Consider the following:
• In an uptrend, price may often bounce off the moving average before being propelled further into the uptrend.
• In a downtrend, the price may often reject the moving average and drop lower.
Traders think of movement in a predictable way. Hence, traders can work their entries closer to pullbacks and place stop loss orders a bit further than the MA to better manage risk.
Moving averages are powerful, but they are even more powerful when used with others:
• Relative Strength Index RSI: Confirms whether conditions have become overbought or oversold in line with the MA.
• MACD: A momentum indicator dependent on moving averages as well.• Support and Resistance Levels: The alignment of a support and resistance level to a moving average provides a stronger signal.
• Fibonacci Retracements: Each Fibonacci level may provide a high probability zone of confluence and added validity when combined with the use of MAs.
Using multiple tools can reduce false signals and increase overall accuracy.
New traders often struggle with using moving averages correctly.
When becoming familiar with moving averages, be on the lookout for the following mistakes:
• Using Too Many MAs: It can be confusing to see multiple moving averages plotted on the same chart, so keep it to 2–3 at most.
• Not Recognizing Market Conditions: Moving averages work best in a trending market. Moving averages will often give false signals in a choppy, sideways market.
• Only Relying on Crossovers: Every crossover needs to be confirmed before acting with the price action, or with another technical indicator.
• Using the Wrong Settings: When plotting a moving average, you need to select the length of the MA according to your trading style, not some random default.
By avoiding these mistakes, moving averages will be used in a much more reliable and efficient manner.
Moving averages are versatile in all financial markets. The following are some examples of how MAs are used.
• Stocks: Moving averages can be used to recognize breakouts in stocks and trend reversals.
• Forex: Moving averages can be used to spot pullbacks when trading trending currency pairs.
• Crypto: Due to the volatility of cryptocurrencies, a moving average can smooth chaotic price action and uncover trends that may not be apparent from a surface examination.
• Commodities: Moving Averages can assist a trader with proper market timing for entry and exit points with the likes of precious metals or oil.
Regardless of the asset being traded, moving averages will help provide clarity and structure.
Let’s say you are holding a stock that is trending upward:
• Price rallies from $100 to $150.
• You plot the 50-day EMA, and notice that the price has consistently bounced off of it.
• Then, on the next pullback, the price touches the EMA and a bullish candle forms, and the price continues to move higher.
With the EMA as dynamic support, you will feel more confident in timing your entry and managing risk.
Moving averages are one of the most researched and easiest tools to use for beginners when it comes to technical analysis.
They assist traders in smoothing out price data, recognizing trends to identify better market timing for strategic entry and exit plans.
Although easy to understand, mastering the use of moving averages requires some context, specifically the right MAs, time frames, and indicators that complement their use. If used properly, moving averages can simplify chaotic price action into an actionable context and ease.
Whether you are a beginner trader only learning the basic concepts or a professional, experienced trader looking to place and improve your strategy, moving averages can be a valuable foundation for your data-driven, disciplined trading portfolio.
Keep building your knowledge with our structured learning path. Each section builds upon the previous one.
This is the first section
You're at the beginning of your journey!
This is the last section
You've completed this course!
15 min
Reading time
Beginner
Difficulty
