
Select your preferred language
Language changes will apply immediately
Select your preferred language
Language changes will apply immediately
Introduction to Pivot Points
"Learn the fundamentals of pivot points in trading. Understand how they are calculated, their importance, and how to use them to identify support, resistance, and breakout levels. "
Wikilix Team
Educational Content Team
Have you ever been stuck on a session, staring at a price chart and contemplating a price point where the price could stall or reverse, only to be caught off guard when it snaps back or breaks out? Enter pivot points. Think of them as quiet bystanders—calculated price levels based on previous candles that sit below the horizon, having almost no weight to be taken in the next session.
If you've ever wanted a simple realm to work with when thinking about either entry, exit, or crowd tendency in a session, look no further. In a moment, you will see how pivot points can turn chart anarchy into calm, easy-to-use insight.
Pivot points are price levels derived from the previous trading period, typically based on high, low, and close values. From that price level, the key zones of interest (sometimes referred to as support and resistance) for the next session are often sought-after points of conversion.
They have a math-based component in that when the price approaches or crosses (typically) these pivots, it better informs the trader and weighs the odds. They are widely used in intraday trading but are also advantageous for swing and even long-term setups.
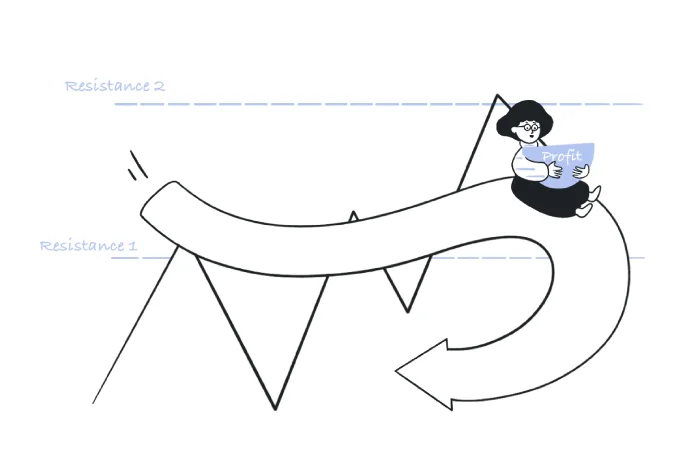
Most basic pivot point (the "standard pivot") is a simple calculation, and from that several additional support and resistance levels are created; these levels help players mark places on a chart to either mark or weight the odds by exhibiting some market behaviour we seek to exploit; stopping momentum, reversing price, accelerating moves or countless insert signals.
Here is a rundown of the "floor-trader" method most often referred to:
• Pivot Point (PP) = (High + Low + Close) ÷ 3
• Support 1 (S1) = (2 × PP) - High
• Resistance 1 (R1) = (2 × PP) - Low
• Support 2 (S2) = PP - (High - Low)
• Resistance 2 (R2) = PP + (High - Low)
Some traders even use S3 or R3 levels, though the first two on each side generally represent the essential price movement. The calculations are easy to remember, and traders often find that price behaviour around the pivot and support/resistance levels is surprisingly reliable.
Creative traders have adapted and built upon the method over time, and here are some of the common variations:
• Traditional (Classic / Floor Trader) - Basically what is described above, easy to use, so it is a popular method.
• Camarilla - Emphasises early session price action and tighter price ranges, making it more useful for day traders.
• Woodie's - Weight is given to the closing price, providing a different location for the pivot.
• Fibonacci-based - Using Fibonacci ratios (0.382, 0.618, etc.) to extend or shrink the usual levels.
• DeMark's Method - More complex logic which alters the calculation depending on where the Close is relative to either the high or low to provide predictions around breakout potential.
Each variation contains the DNA of seeking some order - the varying differences may be helpful for specific timeframes or instruments. For example, the Camarilla levels may be better suited for scalpers, while Traditional or Fibonacci dynamics may be more useful for Swing traders.
The real benefit of pivot points lies in their use in conjunction with other tools. Here are some suggestions to combine them:
• Price action - Look for candlestick signals (pin bars, engulfings) at pivot levels, and you can take setups that have some context to them.
• Volume - If you are entering near a pivot on increasing volume, this gives more significance to the trade.
• Direction of the trend - In a bull trend, R1 or R2 may act as extension targets, in a bear trend, S1 or S2 may act as areas to short.
• Confluence - If a pivot level aligns with horizontal support or resistance, moving average, or Fibonacci area, that will provide extra depth.
• Session timing - At the beginning of the session, pivots may hold; later, they may give in quickly. Be aware of when timelines require swift action or prompt stepping back.
• Bounce or rejection - Price is at a pivot level, price stalls and reverses - setting up potential range trades or confirmation trades.
• Break and retest - Price crosses a pivot, pulls back and tests the pivot, and continues in the direction of speed - signalling that the trend is strong.
• Break and spike - Price slices through a pivot without a pullback - be cautious! Fading this type of move may be a losing proposition, as you have no confirmation.
• Failure to visit - Price does not hit the pivot level; sometimes the market does not need the pivot level, and it doesn't hold; keep an open mind. Knowing how the price typically moves around the pivot points allows you to anticipate, rather than reactively respond proactively.
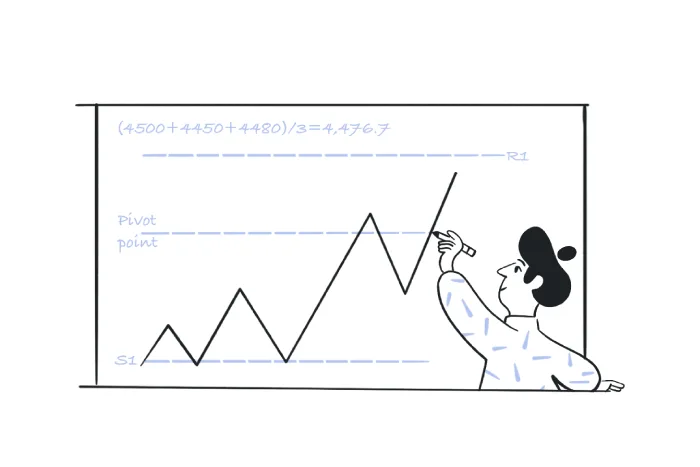
For example's sake, assume the S&P futures will open with the following levels after yesterday's price action: High = 4,500, Low = 4,450, Close = 4,480.
• Pivot Point = (4500 + 4450 + 4480)/3 = 4476.7, R1 = ~4503.4, S1 = 4453.4.
• Let's say early in the session, the price trades down to S1 and starts forming a candle with bullish reversal characteristics (potential bounce).
• You buy near S1 targeting 4476.7 (PP) and than 4503.4 (R1) with a stop just below S1.
• If price pushes through S1 you would consider shorting towards S2.
That's what pivots are about, guiding the entry, the exit, and the structure of the trade—straightforward.
• Always calculate levels in advance of the open.
• Use higher timeframes for assessment of pivots (i.e. if trading with hourly charts, use daily levels).
• Be conscious of overnight price; it may break the range of the open before you log on.
• Don't forget about updates for spikes in volatility; wider sessions may cause pivots to miss.
• Take care about holding onto pivots when the price entirely neglects them; be prepared to review your bias.
Not every setup or trade will adhere strictly to the pivot rules. At times, market activity can become reckless enough to ignore or overshoot pivot zones completely. During these times:
• Don't look to force a trade; a pivot point that the price has ignored or entirely forgotten about is telling you something.
• Don't be afraid to use it in a range context or a trend context, as in isolation, without context, pivots can steer you wrong.
• Be sure to know when to walk away; flat, slow market activity or intense news periods can make your pivot case logic incorrect.
Pivot Points are more than just a point on a chart; they serve as a guide to where traders expect the price to react. By calculating the pivots intentionally, looking for reactions, and layering volume and contextual understanding, you can gain clarity in your trading.
Pivots equal decision-making: from developing entry points, target zones, risk reference identification, and reading market demeanour, with very little guesswork.
If you want a more personalised value, feel free to play with different methods of pivot points or layering with other tools. Just keep it simple, allow pivot points to lead you into meaningful building blocks of the whole structure, and watch how easily your actions shape the visual read of your charts.
If you practice consistency with your charts and decision-making, you may realise that your day of trading is no longer a scramble, but a plan.
Keep building your knowledge with our structured learning path. Each section builds upon the previous one.
This is the first section
You're at the beginning of your journey!
This is the last section
You've completed this course!
17 min
Reading time
Beginner
Difficulty
