
Select your preferred language
Language changes will apply immediately
Select your preferred language
Language changes will apply immediately
Keltner Channels Made Simple: Trade Smarter, Not Harder
"Learn how Keltner channels function, how to incorporate them into trading strategies, and how they can assist in identifying trends and breakout opportunities to make better informed decisions. "
Wikilix Team
Educational Content Team
Have you ever considered viewing price movement as a reflection of the market's rhythm? Where does the chart have a breath and pulses with Volatility? Keltner channels will help you reach that goal.
Whether you're new to the markets, trying to get a grasp on market structure, or an experienced trader looking for precision entries and exits, Keltner channels provide you with an adaptive framework to keep track of momentum, recognise trends, and identify false signals. By the end of the guide, you will know how to understand Keltner channels and how to apply them in your trading strategies.
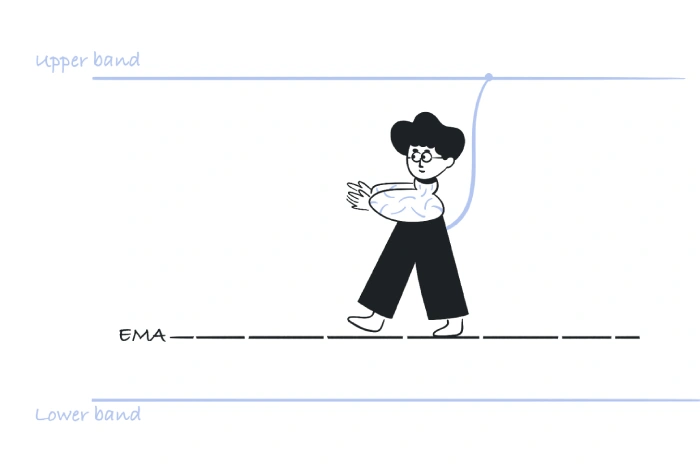
Keltner channels are a technical analysis indicator that is used primarily to determine trends, breakout levels and reversals. The indicator itself consists of three distinct parts:
• Middle Line: A moving average, commonly an exponential moving average, informs trend direction.
• Upper Band: A moving average plus a measure based on Volatility (average true range).
• Lower Band: A moving average minus the same measure based on Volatility.
Keltner channels are not static support and resistance levels; therefore, Keltner channels will grow or shrink as Volatility fluctuates. Keltner channels grow when Volatility increases and contract when volatility is softer.
Keltner channels were initially developed in the 1960s by Chester W. Keltner, who designed Keltner channels with a simple moving average and a measure of trading ranges. Subsequently, economic trader Linda Raschke redefined the Keltner channels by refining the formula in such a way that it made for a more responsive indicator. Her modified version of Keltner Channels changed the simple moving average to be an exponential moving average (EMA).
Instead of measuring Volatility by simply plotting the price, she used the Average True Range (ATR). This updated formula is the formula that most traders and platforms use today because it better accommodates flexible and accurate representations of price action.

Keltner Channels calculations assigned to trading platforms aside, understanding the math behind calculating Keltner Channels will better allow you to interpret the signals it provides. The basic math for Keltner Channels would be:
• Middle Line: 20-period EMA of closing prices.
• Upper Band: EMA + (ATR × multiplier, where the multiplier is usually set to 2).
• Lower Band: EMA − (ATR × multiplier).
This creates a price envelope that expands and contracts depending on the market's Volatility.
Keltner Channels will provide the trader with usable signals of market conditions.
• Price above upper band: strong bullish momentum, potential breakout.
• Price below lower band: intense bearish pressure or breakdown.
• Price between bands: consolidation phase, where the price fails to commit direction.
• Channel slope:
o Upward → bullish trend.
o Downward → bearish trend.
o Flat → range-bound or sideways market.
The following are a variety of common practical ways traders use Keltner Channels in practice:
A) Breakout Trades
If the price closes above the upper belt and is accompanied by increasing volume, this is often a breakout signal. This is generally where traders will enter long positions and participate in the trend until signs of exhaustion appear.
B) Pullback Entries
In strong uptrends, the middle EMA or the lower band may serve as dynamic support to buy into. Traders will wait for the price to pull back into the middle EMA or the lower band to enter, to end up with a better risk-to-reward ratio.
C) Reversal Trading
If prices have tried to push past either band with numerous fails and have since begun to turn inward, this may signal a possible reversal. It would be ideal to use this in conjunction with something like the RSI.
D) Range-Bound Trading
If prices have flat and narrow Keltner channels, this indicates sideways trading conditions with Volatility being low. In this environment, it may be effective to buy close to the lower band and sell close to the upper band.
At first glance, Keltner channels look a lot like Bollinger bands, but there are some distinct aspects to look out for:
• Measuring Volatility:
o Keltner channels are based on Average True Range (ATR),
o Bollinger bands are based on standard deviation.
• Smoothness:
Keltner channels are typically a lot smoother and less erratic bands.
• Best Use Cases:
o Keltner channels are more suited to trend-following,
o Bollinger bands are more suited to spotting Volatility squeezes, fast price expansion.
Many traders will choose to use both tools at once for a clearer image of market conditions.
Advantages
• Clearly Identifying Trends: Keltner channels provide a visually clear indication of the strength and trend direction.
• Dynamic Support/Resistance: the channels change based on Volatility,
• Beginner Friendly: With the default settings, it's a pretty easy way to get into trading Keltner channels.
Disadvantages
• Lagging Indicator: Keltner channels are built from moving averages, which means signals may lag,
• False Breakouts: Sometimes volatile swings in price may create stunningly questionable signals,
• Customisation Necessary: different market segments may need adjusting the EMA period and ATR Multiplier for practical use.
• Always look to Keltner channels in conjunction with strictly price action analysis or other indicators like Volume analysis, MACD or RSI to confirm.
• Always take into account the slope of the channels for better context.
• Always try different multiplier settings for the ATR as everyone has a different trading style, or can be trading in a different timeframe.
• Always try longer timeframes to confirm trades, fewer chances of price false entries.
Keltner channels are one of the more user-friendly and valuable tools in technical analysis. Keltner channels provide a unique and usable process for recovering price volatility, ultimately allowing traders to get a better view of price structure, trend direction and breakout opportunities.
Like all indicators, Keltner channels work best with other indicators and an understanding of price action. Keltner channels can be an excellent tool for trading successfully in fast markets with proper practice and backtesting.
Keep building your knowledge with our structured learning path. Each section builds upon the previous one.
This is the first section
You're at the beginning of your journey!
This is the last section
You've completed this course!
10 min
Reading time
Beginner
Difficulty
