
Select your preferred language
Language changes will apply immediately
Select your preferred language
Language changes will apply immediately
MACD for Trend Confirmation
"Find out how to use the MACD Indicator for trend confirmation and improve your trading overall. Here, you will find everything you need to know about using MACD strategies, signals, and other methods to enhance accuracy and minimize downside risk."
Wikilix Team
Educational Content Team
Have you ever wondered if a price movement up or down signals the start of a significant price trend, or is it merely a short-term price anomaly? If yes, you can save yourself time, money, and mistakes by using the MACD indicator.
It is your navigator in the world of trading; it not only aids in identifying where the market has been, but also gives insight into where it could be headed next.
The ability to use the MACD for trend confirmation is going to help you make smarter trades, and keep you from the confusing mixed signals. We will cover everything you need to know, helping you attain your knowledge in a no-frills, practical way.
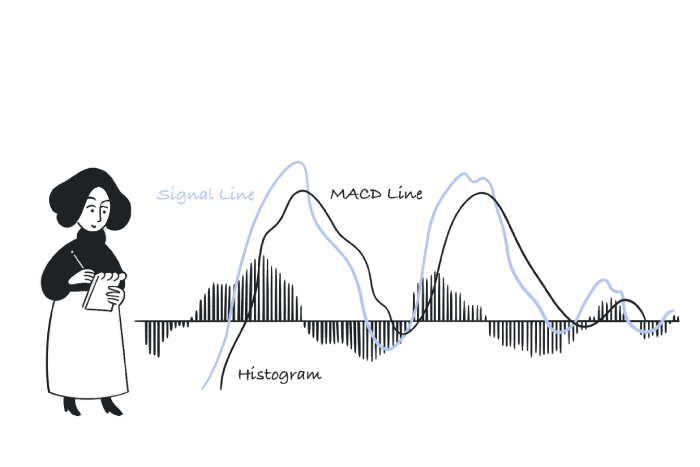
The Moving Average Convergence Divergence (MACD) is one of the most famous technical indicators for determining trends and momentum. The MACD's foundation is on the most basic idea possible: how one measures (the MACD) the relationship between two Exponential Moving Averages (EMAs), which are traditionally the 12-period and 26-period EMAs.
• MACD Line - This is the difference between the two EMAs used.
• Signal Line - This is a 9-period EMA of the MACD line, which will smooth out fluctuations.
• Histogram - The histogram shows the difference between the MACD and the signal line. Than a simple visual application of when momentum is shifting.
All three elements together create a clear picture of what type of momentum is building or fading, and will clarify in terms of confirming whether a trend is worth following.
MACD is not just a trend following indicator; it is a momentum indicator. The MACD line, which detects whether it is above or below the signal line, can often indicate increasing bullish strength, suggesting a continuation of an upward trend.
Conversely, crossing below the signal line suggests increasing bearish pressure, indicating a potential downtrend. The zero line crossover is also significant. When the MACD moves above the zero line, the short-term momentum is stronger than the long-term trend, confirming bullishness.
When it falls below the zero line, it is the opposite case. These characteristics also imply MACD is particularly good for establishing whether a move is genuine or whether any moves are in fact simply short-term volatility.
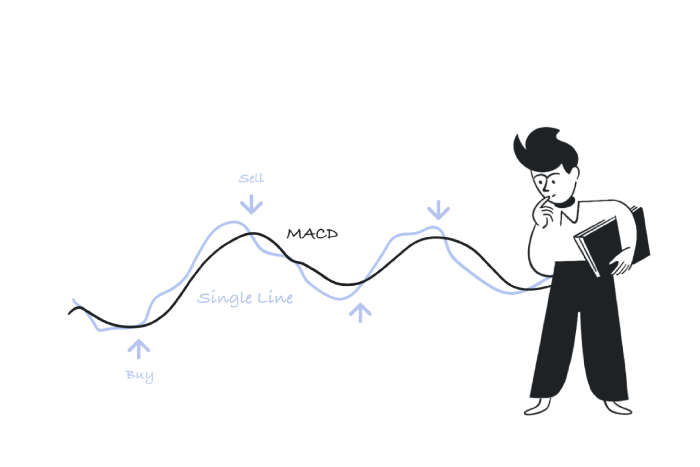
The most typical way to use MACD is to wait for the MACD line to cross the signal line.
• When the MACD travels above the signal line, that is referred to as a bullish crossover, indicating that a possible uptrend is forming.
• When the MACD travels below the signal line, this is referred to as a bearish crossover. Effectively, a bearish crossover and bearish strength/ momentum could yield an even bigger down move.
Usually, these crossovers will be an example of when to buy or sell, but we should consider the trend of the market as well.
Another way to create early signals about the change in the trend would be the shift in the MACD histogram. An example of a shift would be:
• When the histogram goes from negative to positive, it indicates that bullish momentum is returning.
• As the histogram shifts from positive to negative, it indicates an early warning that bearish pressure is returning.
This is when the histogram can help a trader identify and trade a trend change before any crossover occurs. Divergence Signals
Divergence occurs when the price action and the MACD move in the opposite direction.
• Where bullish divergence occurs, the price makes lower lows, but the MACD makes higher lows. This may signal a potential upside reversal.
• Where bearish divergence occurs, the price makes higher highs while the MACD makes lower highs. This may signal a momentum loss, and the price is likely going to reverse downward.
Divergence will be particularly useful when figuring out whether a strong-looking trend is ready to lose its strength.
Although MACD can be powerful by itself, if it is combined with many other technical indicators, you can make even more accurate trades and avoid weak signals such as fake breakouts:
• Moving Averages: Longer-term EMAs like the 50 EMA or 200 EMA can eliminate crossovers that are going against the trend.
• RSI (Relative Strength Index): If you pair MACD with RSI, you can assess whether there is momentum or if you are entering into an overbought or oversold market.
• Price Action: If you have a support or resistance zone alongside MACD confirmation, you have a strong entry.
When you use MACD with these other tools, you build a stronger strategic approach to trading.
Different styles of traders will require a slightly different set-up of MACD:
• For Day Traders: short EMAs (for example: 8 and 21) are more beneficial for faster signals and help traders make a quicker decision when acting on short-term opportunities.• For Swing Traders: Use the traditional settings (12, 26, 9) to be able to assess medium-term trends quickly.
• For Long-Term Investors: Use longer EMAs (20 and 50) to confirm trends on longer timeframes such as weekly or even monthly charts.
By adjusting the MACD settings, traders can customize the indicator to fit their preferred time implications and trading requirements.
The MACD is a highly flexible tool, but like everything else, it does have its limitations. Here are some tips to help you capitalize on MACD and avoid the pitfalls.
• Avoid Choppy Markets: MACD will perform best in trending markets. In sideways markets, you will see more false-trading signals
• Look for Confirmation: Avoid jumping in on the first sign of a crossover, look for confirmation such as histogram shift or price closing above the 20-period EMA
• Back-test Your Concept: Back-test any MACD-based strategy on historical data to evaluate how your concept will perform in different trading conditions.
• Use Multiple Timeframes: When developing a MACD signal, ensure that the signal is considered on daily, weekly and intraday charts.
In summary, by assessing each of these best practices, you can reduce your risk and improve your decision-making.
Let's say a stock has been consolidating for a few weeks, moving sideways within a tight range and then all of a sudden, the price breaks above a resistance level. Should you buy right away?
Here's where using MACD can come in handy:
1. Look at the MACD line itself – Is it crossing above the signal line? If yes, this indicates that price action supports the recent breakout and likely confirms an uptrend.
2. Look at the histogram – Are the positive (green) bars increasing in height? Increasing green bars usually indicate increasing momentum (acceleration) and confirm an uptrend.
3. Confirm that MACD has crossed above the zero line to support further that bullish price action may be dominating the market.
When using all of these signals, you will have much better conviction in entering as opposed to simply jumping in unquestioningly.
The MACD has survived in the trading world because it includes trend recognition and momentum analysis, all in the same framework. It's much easier to use and understand than some of the more complicated tools, and it can be applied in multiple markets, including stocks, forex, crypto, commodities, and other financial instruments.
Regardless of whether you are a beginner or seasoned trader, knowing how to use MACD will help you identify opportunities earlier and confirm trends with more certainty.
When trading, nothing can be more costly than making assumptions; on the other hand, acting on confirmation is one of the most powerful actions you can take. The MACD indicator helps you do this as it enables you to analyze direction, momentum, and potential reversals - in effect allowing you to make sense of genuine trends versus noise in the market.
Appropriately used, in particular in conjunction with other tools in the market, MACD can be more than just an indicator; it can be a pathway for making decisions. With practice, you can become more confident at reading and interpreting market moves like an expert trader, make better decisions, and of course, be a more intelligent trader.
Keep building your knowledge with our structured learning path. Each section builds upon the previous one.
This is the first section
You're at the beginning of your journey!
This is the last section
You've completed this course!
20 min
Reading time
Beginner
Difficulty
