
Beginner
Oscillators and Momentum Strategies Demystified
Oscillators and Momentum Strategies Demystified
"Confused by oscillators and momentum strategies? Discover how tools like RSI, MACD, and Stochastic Oscillator reveal market strength and help you time your forex trades like a pro.""
Wikilix Team
Educational Content Team
July 30, 2025
15 min
Reading time
Beginner
Difficulty
#learningwave#OscillatorsandMomentumToolsExplained#forex

Do you feel as if you are always behind in the markets--buying right before prices drop, or selling right before a rally? You are not alone; many traders experience the same issue. Even when they believe the preparation has been done correctly, they still find themselves as bystanders.
The job of traders is to decide to buy or sell an asset, which can become a real problem. Fortunately, there are tools like oscillators and momentum strategies that will surely bring value to the table, as they are both metrics of timing.
Think of oscillators and momentum strategies as a compass that can help point you toward a possible uncertain trend, and possibly lead you to a potential turning point before many traders are even aware. In this post, we are going to run through what oscillators and momentum strategies are, how they come about, and how you can use them today as a trader and investor. No more excuses for not having a trading system, whether you are uncool in mathematics or not, or a seasoned market professional.
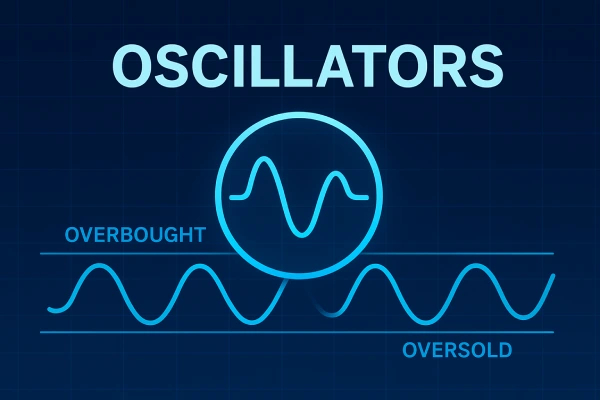
What Are Oscillators?
Oscillators are technical indicators that oscillate over a range (usually from 0 to 100) designed to measure specific market moments and identify whether an instrument is "overbought" or "oversold". In the simplest terms, the logic is that when the direction is too far or too fast, it is probably time to stop or change directions.
Oscillators will help generate these moments to forecast a change in price momentum.
A few of the more popular oscillators are:
• Relative Strength Index (RSI): Evaluates the degree of recent price movements. Readings above 70 may specify overbought conditions, while readings below 30 may indicate oversold conditions.
• Stochastic Oscillator: Compares one particular closing price to a price range over time, often indicating potential reversals.
• MACD (Moving Average Convergence Divergence): Although a momentum indicator, MACD is used as an oscillator to identify trend changes.
Momentum: The Invisible Force in Price Action
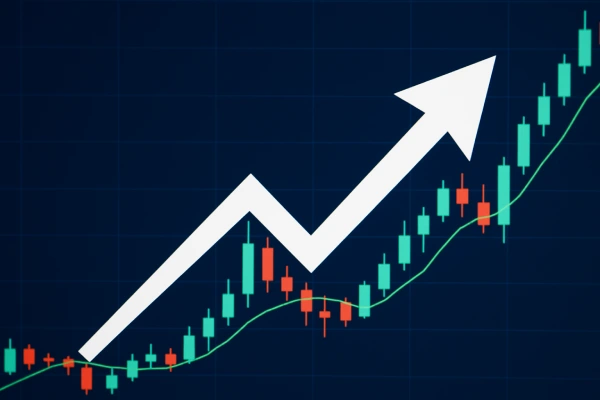
Momentum strategies focus on riding the momentum of a strong trend. Based on the principle that assets that have done well in the short-term past will likely continue to do well in the short-term future, and assets that have lost value will likely continue downward. Momentum is about speed, direction and conviction.
Momentum indicators measure the rate of change of price. If the price is moving up and gaining momentum, it indicates a positive trend. If it is falling downward with speed, it has negative momentum. These tools are designed to help confirm the strength of a trend and alert traders when the momentum is losing strength.
Examples of typical momentum indicators include:
• Momentum Indicator (simple rate of change) - measures the extent of price movement over some time.
• MACD histogram: This indicator shows the distance between the MACD line and its signal line - a graphical representation of momentum strength.
• Rate of Change: This measures the speed of price change relative to a prior point in time.
Why Use These Together?
Although oscillators and momentum tools can work well on their own, they are more effective when used in conjunction with one another. Think of oscillators as your early warning signal, while your momentum tools help confirm the signal. One tells you what the future position may be, while the other tells you how much strength that move might have.
For example, if the RSI has an oversold position, you may want to go long, as it is a late cycle in its change. However, if momentum is still quite negative, that bounce is likely at least temporary. One thing that can help is waiting until momentum shifts across several tools to improve your timing.
Real World Trading Example - RSI + MACD
Let's consider a tech stock that has experienced several days of decline. The RSI is currently at 25, indicating an oversold position. This is enough to get your attention. However, you also check the MACD and notice the histogram is still down, meaning that downward momentum will likely continue for a while longer.
Instead of prematurely jumping in, you instead wait. A few days later, the MACD histogram flattens out and begins to increase – the momentum is shifting. You enter the trade then. The trade was a success, and this simple combination of tools helped you not only avoid entering during a downtrend but, more importantly, improved your overall entry timing.
Common Mistakes Traders Make
Although these tools are part of the standard trading toolbox, they are still misused. Here are some common examples:
1. One tool in isolation: No tool is perfect all of the time; always validate using other tools or action price.
2. Contextual ignorance: An overbought reading during a strong uptrend is not always a reversal; it could indicate strong continued demand.
3. Over-optimising settings: Tweaking your settings according to past data (also called overfitting) can create a perfect-looking model after the fact, but is useless in live view.
How to start using oscillators and momentum strategies today
You do not need an elaborate setup or expensive software to get started. Here's a straightforward step-by-step plan:
1. Choose one oscillator and one momentum tool.
As a beginner, try RSI + MACD or Stochastic + ROC.
2. Place them on your favourite asset.
Whether you want to trade stocks, forex, crypto, or commodities, they all work.
3. Look for confluence.
Look to enter a trade when both indicators show a possible signal. For example: oversold RSI + increasing MACD histogram.
4. Always use a stop-loss.
No indicator is guaranteed. Risk management is your safety harness.
5. Measure your results.
Keep a trading journal. Over time, you will begin to notice patterns and improve your strategy.
Advanced Tips for More Experienced Traders
If you are comfortable with the basics, here are a few more advanced ideas:
• Divergence Trading: Look for conditions when the price makes a new high, but the oscillator does not. This can indicate weakening momentum and possibly a reversal.
• Consider multi-timeframe analysis: Look to oscillators on the longer timeframe to find the general trend, then use the momentum indicators on the short timeframe for entry.
• Combine with price action: Validate your signals on price action with candlestick patterns or support and resistance zones.

Conclusion
At first, oscillators and momentum strategies seem technical. But after they become familiar, they begin to make sense. They aid in recognising what others may overlook - such as the faint signs of when a trend may be stalling, when a reversal may be happening, or when to wait a bit longer. As we have outlined earlier, it is not just about using these tools, but utilising them properly, and within the context under consideration.
The markets will always have ups and downs. But, with the right tools in hand, and a little patience, you can learn to ride them instead of getting washed in each one. Start small, stay consistent, and momentum will work to your advantage.
Continue Learning
What's Next?
Keep building your knowledge with our structured learning path. Each section builds upon the previous one.
This is the first section
You're at the beginning of your journey!
This is the last section
You've completed this course!