
Select your preferred language
Language changes will apply immediately
Select your preferred language
Language changes will apply immediately
Moving Average Crossovers
"Find out how moving average crossovers can help traders identify trend reversals as well as entry or exit points. Become proficient in using moving average crossovers, including both SMA and EMA crossovers, to achieve consistently better trading performance."
Wikilix Team
Educational Content Team
Suppose you've ever wondered how some traders can catch big price moves at just the right time. In that case, the answer is usually as simple and effective as using one of the most popular recommendations in technical analysis—moving average crossovers.
Professional traders often use this crossover to signify a possible trend reversal and buying or selling opportunity, with confidence. Learning about moving average crossovers is something every trader should become familiar with. It can change your trading strategy, whether you are a fresh beginner just learning how to read charts or an advanced trader looking to improve your existing strategy.
This is Understanding Moving Average Crossovers; we are going to break everything down through a step-by-step review, simple, coherent, and practical.
A moving average crossover occurs when two different moving averages plotted on a price chart intersect.
These averages are typically characterized by a short-term moving average (10 or 20 periods) and a long-term moving average (50 or 200 periods). Simply put, when these two lines intersect, it produces a signal.
• If the short-term moving average crosses above the long-term moving average, it indicates a possible upward action, and is often called a buy signal.
• If the short-term moving average crosses below the long-term moving average, it indicates possible downward action, and is often referred to as a sell signal.
Because of its simplicity, this is a beneficial trading process when starting.

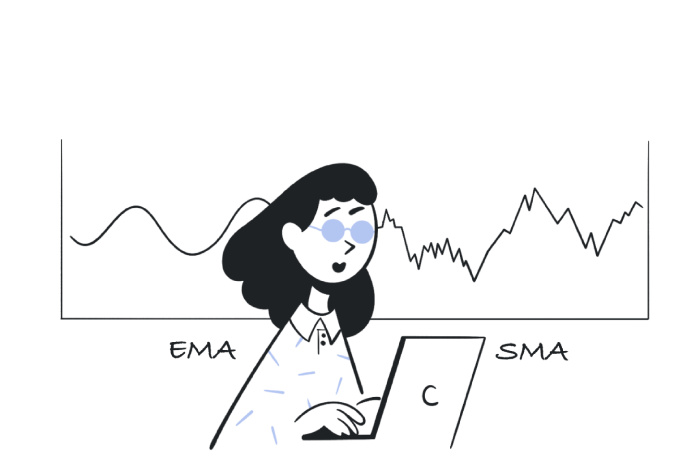
Currently, let's take a very brief moment to review the two types of moving averages typically used for crossover strategies:
Simple Moving Average (SMA)
• Calculating the average price over a given period
• Providing equal weight to each data point
• Good for long-term trend analysis
Exponential Moving Average (EMA)
• Gives more weight to recent prices. More responsive to recent changes/trends
• Better for short-term traders
• Especially useful for faster-moving markets, like crypto and forex.
Many traders use a combination of both, such as an EMA for quick signals and an SMA to confirm the overall trend.
The Golden Cross and Death Cross are two of the most well-known moving average crossover patterns.
Golden Cross (Bullish Signal)
• Often appears when a short-term moving average (50-day MA, for example) crosses above the long-term moving average (200-day MA, for example)
• Usually taken as confirmation that a new uptrend is likely forming
• Traders look for these setups to enter long positions early
Death Cross (Bearish Signal)
• It is created when the short-term moving average crosses below the long-term moving average
• Indicates that downtrend momentum is now possibly taking place
• A frequent method that traders use to exit or initiate short positions
Crossovers are still one of the most widely used strategies because they are:
• Easy to understand! No complex formula to delve into.
• Objective! Clear image signals to remove emotional decision-making
• Flexible! Suitable for use on stocks, forex, crypto, and commodities.• Flexible: Works well with novice and seasoned traders.
Unless, as you will see in the next section, crossovers provide an unconfirmed signal, false signals may arise.
The periods you choose for your moving averages may have a significant impact on results. The most common combinations are:
• Short-term trading: 5-day EMA and 20-day EMA.
• Swing trading: 20-day SMA and 50-day SMA.
• Long-term investor: 50-day SMA and 200-day SMA.
The shorter the periods, the quicker the crossover triggers; however, the potential for false signals also increases. The longer the period, the stronger the confirmation; however, this may lead you to delayed entries.
Entry Points
• A bullish crossover is usually a buy signal
• If it's confirmed by rising volume and solid price action, then great!
Exit Points
• A bearish crossover is usually the signal to exit a position
• Some traders who reverse positions entirely think that they have identified the formation of a new trend.
Pro tip: Always use dollar stretch orders when trading crossovers and use them to protect against unexpected reversals!
One downside to moving average crossovers for creating entry and exit points is their tendency to produce false signals, especially in a sideways or choppy market. Ideally, you want to:
• Use crossovers with momentum indicators, such as RSI or MACD.
• Trade only in clear upward or downward trending markets where directional signals are more reliable.
A common practice among traders is to combine SMA and EMA in a blend of crossover strategies:
• A faster EMA will allow you to react faster than the slower SMA.
• A slower SMA can filter out noise and confirm the recent trend.
Again, treat this as an example:
• A 20-day EMA crossing above a 50-day SMA might point to early bullish momentum worth acting on.
• An EMA crossing back below the SMA could indicate downward momentum and a likely reversal before it shows up on other early warning indicators.
Crossover indicators work reasonably well across many asset classes. However, how the average performs will change:
• Stocks: The crossover indicators are best suited for identifying long-term changes in the general direction.
• Forex: Not only do Forex traders use a longer and slower SMA or EMA indicator, they also employ short-term EMAs for quick entry and exits while scrambling in and out of trades.
• Cryptocurrency: Crossover indicators can be helpful depending on how a cryptocurrency reacts to price points when there can be highly volatile or quick closure to the price generated.
• Commodities: Crossover indicators are helpful to allow traders to identify breakout trading in trending markets.
Understanding how your selected asset behaves or reacts to volatility will help you appropriately use crossover indicators in the context of your trading.
Let's say you are trading a stock currently priced at $100.
• A trader can plot the 50-day Simple Moving Average (SMA) and 200-day SMA.
• The 50-day SMA crosses over the 200-day SMA, resulting in a Golden Cross.
• The following day, volume increases, showing there is bullish strength in the market to confirm a trade, so you enter a long trade.
• Weeks later, the price had run up to $130, and there was a bearish crossover appearing on the trend, indicating it was time to take a profit.
Using this method and structured format allows you to make informed trading decisions using past price data, rather than relying solely on your gut feelings.
Many traders will make mistakes that can be easily avoided when trading based on moving average crossovers.
• Trading off a crossover only. Traders should always have additional indicators confirming their analysis.
• Trading while using too many moving averages. When a trader creates overly complicated charts, it creates delays and confusion.
• Trading in a market with little volatility, aka a sideways market. Traders will encounter frequent whipsaws and losses.
• Not being proactive to confirm risk or exit a trade at a price point. No matter how actionable the signal, without a stop-loss, a trader can experience losses despite good signals.
If you can avoid these mistakes, crossovers can be a long-lasting and solid base in any trader's toolkit.
Moving average crossovers are one of the most powerful trading indicators for identifying possible trend reversals and finding potential entry and exit levels.
• Shorter EMAs can speed up the signals when you trade volatility, and you have a nice, calm, longer SMA and ride the patterns.
• Longer SMAs create stronger confirmations and have a lot longer to go, or a period you can.
• Combine moving average crossover indicators with others to filter out noise better and increase Accuracy.
If you use your indicators correctly, you have great potential to be successful, reduce decision-making influenced by emotion, and ultimately increase your profitability.
Keep building your knowledge with our structured learning path. Each section builds upon the previous one.
This is the first section
You're at the beginning of your journey!
This is the last section
You've completed this course!
18 min
Reading time
Beginner
Difficulty
