
Beginner
Moving Averages in Trend Analysis
Moving Averages in Trend Analysis
"Want to spot market trends with more confidence? Discover how moving averages can help you analyze price direction, filter noise, and make smarter forex trading decisions.""
Wikilix Team
Educational Content Team
July 30, 2025
10 min
Reading time
Beginner
Difficulty
#learningwave#MovingAveragesinTrendAnalysis#forex

Have you ever looked at a price chart, dizzy from all the ups and downs, and wondered if the market is going up, down, or just around in circles? Don't worry; you're not alone. The toughest task traders struggle with is determining the trend, as the market does not always move in a straight line. That's where moving averages come in. These simple yet sophisticated tools iron out price data and reveal the underlying trend of the market. Moving average mastery can provide you with clarity, confidence, and an edge that is worth having when making your trades, no matter if you are a novice or a professional trader. Let us examine how they function, their significance, and how to use them best to trend analysis.
What Is a Moving Average?
A moving average (MA) is a technical indicator that displays an asset's average price over a specified period. Instead of observing every slight price move, a moving average allows you to observe the larger picture by filtering out noise.
There are two simple forms of moving averages:
• Simple Moving Average (SMA): Average of different closing prices. A 10-day SMA would add the last 10 closing prices and then divide by 10.
• Exponential Moving Average (EMA): Exactly the same as the SMA, but more responsive to new prices because it gives more weight to them.
Why Moving Averages are Crucial in Trend Analysis
Moving averages are one of the basic technical analysis tools because they simplify by reasoning it out of chaos. Here is why they are essential.
1. Trend Identification: MAs enable you to immediately know if the market is trending upwards, downwards, or sideways.
2. Support and Resistance: Moving averages have a tendency of being dynamic support and resistance levels.
3. Signal Generation: Crossovers among different MAs can indicate possible entry or exit points.
4. Confirmation Tool: MAs confirm signals from other indicators, such as RSI, MACD, or price action.
Choosing the Right Period for Your Moving Average
The period you select will determine the sensitivity of the MA:
Timeframe\tPurpose\tTypical Use
Short (5–20)\tIdentify short-term trends or entries\tDay trading, scalping
Medium (20–50)\tFollow intermediate trends\tSwing trading
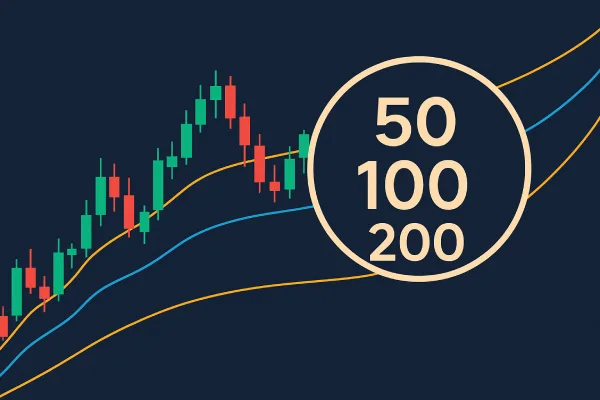
Long (100–200)\tIdentify dominant trend directions\tPosition trading
For example, 50-day SMA is widely used to track medium-term trends, and 200-day SMA is widely used by institutions as a guide to the long-term direction of the market.
Applying Moving Averages in Trend Analysis
1. Identifying Trend Direction
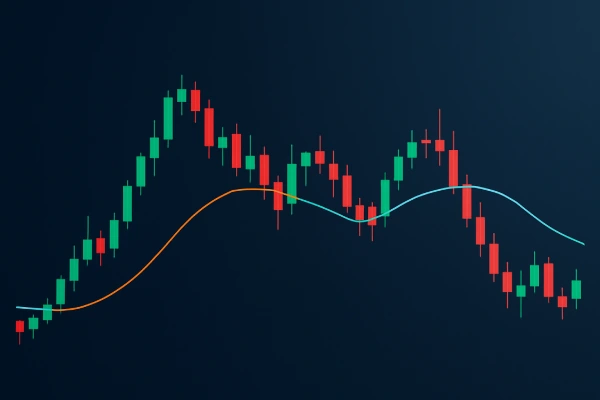
The direction of the moving average determines the trend direction:
• Moving up, the market is trending up.
• Moving down, the market is trending down.
• Moving sideways, no trend (range-bound).
You can also compare the price position in relation to the MA:
• If price is above the moving average → bullish signal.
• If price is below the moving average → bearish signal.
2. Employing Multiple Moving Averages
Combining short-term and long-term MAs enables offering a larger picture.
Traditional combinations:
• Golden Cross: 50-day SMA crosses above the 200-day SMA → bullish trend signal.
• Death Cross: 50-day SMA falls below the 200-day SMA → bearish trend signal.
Short-term MAs crossing long-term MAs are classic trend-reversal signals.
3. Moving Averages as Dynamic Support/Resistance
During trending conditions, moving averages are often areas where price bounces off of.
For example:
• Uptrend: 50-day EMA can be support—a good long entry zone.
• Downtrend: 50-day EMA can be resistance—a potential short entry zone.
Moving Averages and Market States
Moving averages are more helpful in trending markets and less helpful for sideways markets. Here's how to adjust:
•In strong trends, shorter EMAs (e.g., 9 or 20) will work better as they're more sensitive.
•In sloppy markets, longer SMAs (e.g., 100 or 200) filter out false signals.
Pro Tip: Filter out ranging markets using indicators like Average Directional Index (ADX) when employing MA strategies.
Example: Application of Moving Averages in a Forex Trade
Suppose you are trading the GBP/USD currency pair.
• The 50-day SMA on the daily chart is sloping upwards, and the price is trading well above it.
• There is a recent dip that brings the price down to touch the 50-day SMA.
• You search for a bullish candlestick pattern (e.g., hammer or engulfing) near the moving average.
• This is a long position setup: buy near the MA with a stop loss just below, and take-profit at a recent swing high.
This strategy uses trend analysis, confirmation, and support levels all in one tool—moving averages.
Mistakes to Avoid
Moving averages are simple to utilize, yet there are some pitfalls to be aware of:
❌ Wrong type for your style: EMAs are suited for fast markets; SMAs are suited for longer trends.
❌ Overcharting: Too many MAs will confuse you. Stick to 2–3 max for best clarity.
❌ Forgetting price action: MAs are tools—not laws. Always watch candlestick activity and sentiment also.
❌ Trading crossovers blindly: Wait for confirmation before trading on a crossover signal.
Using Moving Averages with Other Tools
Moving averages are even better when combined with other forms of analysis:
• With RSI: Buy MA support when RSI is oversold.
• With MACD: Confirm bullish crossovers with moving average support.
• With Fibonacci: When an MA crosses a Fib level, it creates a strong confluence zone.
• With Trendlines: Bounce at the intersection of an MA and trendline is bullish.
With Confluence, your analysis becomes more solid.
Which Moving Averages Do Professional Traders Use?
Following are some of the most popular MA settings:
Type Period Use Case
20 EMA Short-term trend following in volatile markets
50 SMA Medium-term direction of trend
100 SMA Long-term confirmation
200 SMA Institutional trend benchmark
Most professional traders will use a combination of some of the above, modified for market type and time frame.
Conclusion:
Moving averages may seem simple, yet their application in trend analysis is enormous. They remove the noise, reveal direction, and offer clear entry, exit, and stop-loss areas. Whether trading forex, stocks, or cryptocurrencies, moving averages can serve as your navigator in chaotic markets.
But remember—moving averages don't predict the future. They interpret the past to guide your decisions in the present. Used intelligently, they can impose order and discipline on your methodology.
So the next time the market seems confusing, step back and look at your moving averages—they might be screaming at you louder than you think.
Continue Learning
What's Next?
Keep building your knowledge with our structured learning path. Each section builds upon the previous one.
This is the first section
You're at the beginning of your journey!
This is the last section
You've completed this course!