
Select your preferred language
Language changes will apply immediately
Select your preferred language
Language changes will apply immediately
Pennants and Wedges
"Learn to identify and trade wedge and pennant charts. Learn how they form, breakout options and some trading-related tips."
Wikilix Team
Educational Content Team
Imagine watching a stock or crypto price skyrocket like a rocket, only to suddenly pause and start moving sideways, but within a progressively smaller range. You think, "Is the rally finished or is the market having a breather"?
This is where pennants and wedges come into play. Specifically, these types of patterns can give traders some valuable insight into what can happen next. Understanding pennants and wedges is essential, whether you are day trading or holding for a long time.
Understanding these patterns can help you enter trades sooner, deal with risk better and help you feel more confident about your trading decisions.
In this article, we will take a deep look at wedge and pennant patterns; what they are, how they form, and how professionals take these patterns and put them to use in trade.
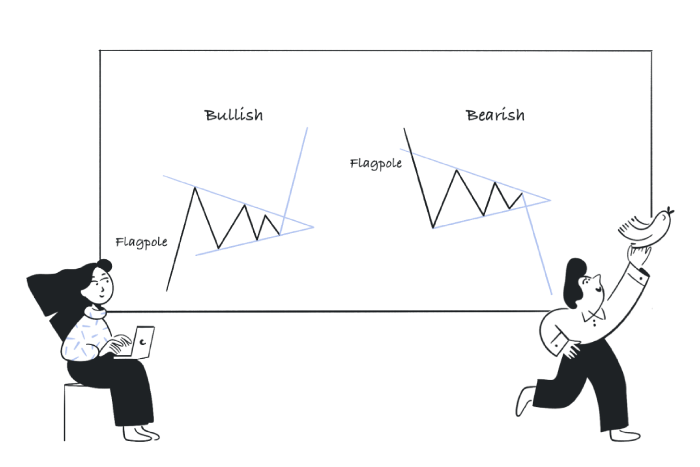
A pennant is a short-term continuation pattern that arises after a substantial price move (the flagpole). This is a small symmetrical triangle, where price pulls back, before needing to break out again in the direction of the first price movement of the stock.
There are a few common aspects that pennants exhibit:
• Original move: has a sharp price movement; the sharp price move (either up or down) (flagpole) creates the pennant pattern that follows
• Consolidation: price is moving and is essentially moving sideways, but is contracting between two converging trend lines, creating the pennant shape.
• Breakout confirmation: if price has paused, chances are it will breakout in the same direction of the original move.
• Volume behaviour: when price is consolidating, volume typically patterns down to nothing before surging when price breaks out.
Example Situation
Let's say Bitcoin moves from $25,000 to $27,000 in a few hours. Instead of retracing, the price starts to form a small triangular pennant. After two days, the price broke above $27,000 with significant volume. Both retail and institutional traders see this as confirmation to get long for the next bullish leg up.
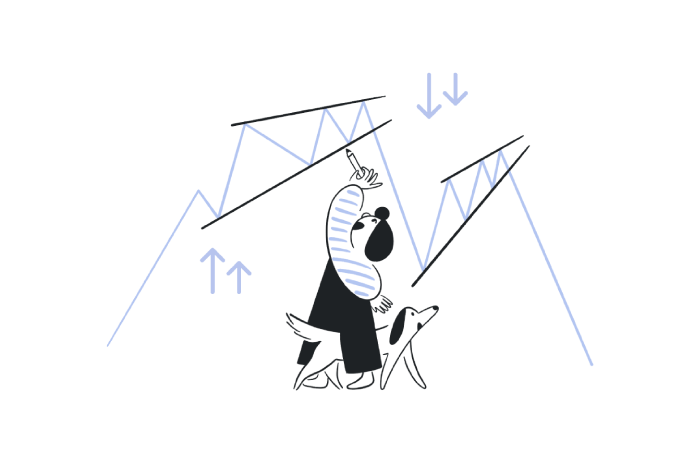
Wedges are like pennants in that they can represent both continuations and reversals depending on the wiggle and context. Wedges form when price is squeezed between two sloped trendlines, and have a tilt up or down.
Types of Wedges
• Formation: Both trendlines are sloping upward, but the upper trendline is rising at a slower pace than the lower one.
• Meaning: (Reverse buy) The rising wedge will most likely be interpreted as a bearish reversal pattern depending on where it forms in the Market. (i.e. while price is moving up, creating the wedge upward).
• Breakout: Price will ideally break below the lower trendline, signalling a potential downturn.
• Formation: Both trendlines are sloping down, but the lower line is falling at a steeper trajectory.
• Meaning: (Reverse sell) A falling wedge will generally mean you're looking at a bullish reversal if you spot it while the price is moving downward to form the wedge.
• Breakout: Price will most likely break out above the upper trendline and signal buyers are gaining strength from a breaker point.
The more you practice spotting them, the easier it gets. Here is a checklist to make it easier for you to recognise pennants and wedges:
For pennants:
• You first need to see a good, strong flagpole move - if you have no flagpole, you don't have a pennant.
• Look for converging trendlines to form a small symmetrical shape.
• Look for a breakout in the same direction as the previous move.• Confirm the breakout from either pennants or wedges on volume spikes or other indicators.
For Wedges:
• Find a pair of sloping trendlines: both should be upward or downward.
• Find touchpoints on each trendline - at least two on each side.
• Look for a narrowing pattern in price action toward the apex.
• Look for a decline in volume during formation and an increase in volume at breakout.
1. Entry Point:
Set a buy or sell order just above or below the pennant's boundary, depending on where it breaks out.
2. Profit Target:
Take the length of the flagpole and project it from the breakout point.
3. Stop-Loss Placement:
Set any stops just outside the opposite side boundary of the pennant to minimise loss.
• Short Setup: Go short, as a selling signal, when the price breaks below the bottom trendline.
• Target Price: Take the measurement off the broadest part of the wedge and project down
• Stop-Loss placement: Place stops just above the last swing high inside of the wedge.
• Long Setup: When price breaks above the upper trendline, place a buy order.
• Target Price: Same as above, the width of the wedge can suggest the next bullish move.
• Stop-Loss: Place stops just underneath the last swing low inside the wedge.
Even veteran traders will misinterpret pennants and wedges. What to watch out for:
• Confusing random consolidations for patterns: It won't be a pennant if it doesn't have a flagpole. It won't be a wedge if it doesn't have converging lines.
• Not waiting for confirmation of breakout: Wait until you see the closing candles above the trendline paired with good volume.
• Neglecting the market context: A rising wedge may break upwards in a strong bull market. There is no certainty with a pattern – things can happen.
• Lack of risk management: As perfect as it may seem, some setups fail. Never risk more than you can stand to lose.
Traders often use other technical tools to verify the pennant and wedge signals to increase accuracy:
• Volume Analysis: Breakouts with substantial volume carry more validity.
• Moving Averages: Once you see the breakout, if appropriate, consider seeing where it is in relation to short-term and long-term moving averages.
• RSI & Relationship to Momentum Indicators: An overbought or oversold reading can further confirm reversal setups.
• Support & Resistance: Identify what your trade is and if the breakout coincides with significant historic price barriers.
Let's apply some real-life scenarios.
When Ethereum is in a clear uptrend from $1,600 to $1,850, you observe a pennant. The pennant is perfect; volume is decreasing. Price is breaking above $1,850 with increasingly good volume; you trade with a long entry at $1,860 and place a stop-loss at $1,820.
What was your target? To assess the outcome, you took the flagpole length ($250) and projected it upwards, targeting about $2,100. So, if the momentum keeps flowing, you can beat the odds with a higher probability setup that meets structure, timing, and risk control.
So, from this point on, pennants and wedges should not just be shapes on a chart; they should be thought of as windows into the psychology that is reflected in the Market.
• Pennants represent short pauses in the Market as trends resume; a pennant provides us with a precise way of taking advantage of any continued trend.
• Wedges are indications that the momentum is potentially fading; typically, a wedge can lead to a reversal of some kind.
• All of the above require confirmation of the breakout, volume analysis, and active risk management; work to ensure you meet all of the above criteria.
Although repeating the above will not guarantee you will always be right when using pennants and wedges, your trading model will be given a framework of structure, clarity, and confidence; three traits that you need to develop consistency as a trader (crazy, right?).
The next time you see the Market making a narrow squeeze on your chart, take a closer look; the Market could just be whispering about the next big move.
Keep building your knowledge with our structured learning path. Each section builds upon the previous one.
This is the first section
You're at the beginning of your journey!
This is the last section
You've completed this course!
17 min
Reading time
Beginner
Difficulty
