
Beginner
Professional Market Forecasting Based on Pivot Points
Professional Market Forecasting Based on Pivot Points
"Want to forecast market moves like a professional? Find out how pivot points are helping traders find essential support and resistance levels - critical to creating a confident and strategic trading plan!""
Wikilix Team
Educational Content Team
July 31, 2025
17 min
Reading time
Beginner
Difficulty
#learningwave#PivotPointsinMarketForecasting#forex

If you've ever looked at a chart and wondered if the market will turn or continue with the trend, you are not alone. One of the more common problems traders face is timing, because it is not just about knowing where the market is going; it is knowing when to act. Pivot points can help with that.
Used by professionals for decades, pivot points are easy tools that provide some level of expectation of potential price levels in which markets tend to react. They are not magic. They do not predict the future. But used appropriately, they provide the core framework for making better and more confident trading decisions. In this article, we will discuss how pivot points work, how they are professionally utilized for forecasting, and how you can use them in your trading, with zero advanced mathematics or complicated detail.
What Are Pivot Points?
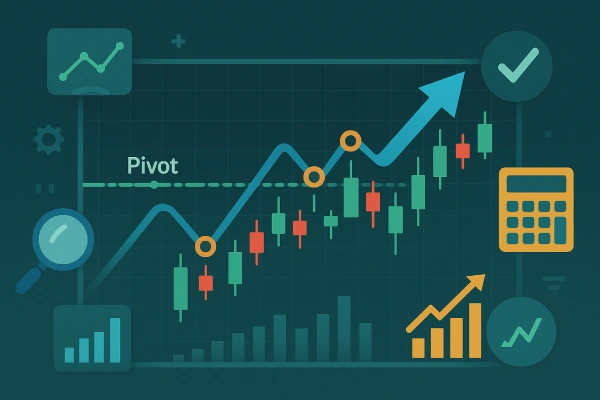
Pivot points are a method of technical analysis that helps determine potential support and resistance levels based on previous price action. Traders often use the pivot points to help forecast where the price might stall, reverse, or break out from. The difference with pivot points is that they are derived from price data from a previous period--usually the high, low, and close of the last day.
The basic pivot point (P) can be calculated as follows:
P = (High + Low + Close) / 3
Once you have P, you calculate several levels:
• Support 1 (S1) and Support 2 (S2)
• Resistance 1 (R1) and Resistance 2 (R2)
Some traders will calculate S3 and R3, but for most traders and strategies, S1 and S2 are more than enough levels.
Why Pivot Points are Important for Market Forecasting
Market forecasting is not about predicting the price the market will be at, the precise time the market will move, or any other variable of a specific move; rather, it is about determining high-probability zones--potential areas of activity. That's a good way to think about pivot points: they give you a map of potential reaction levels.
So, why do professional traders like pivot points?
• Because they are based on price instead of subjective settings like moving averages or oscillators.
• Because they can better construct a general pattern of a trending or ranging market.
• They are simple to use across any asset or time frame
No matter whether you are day trading forex, swing trading stocks, or managing your positions in crypto, pivot points work in any environment.
Using Pivot Points for Forecasting: A Pragmatic Approach
Pivot points can be used in numerous ways, depending on market conditions. Let's explain it.
1. Forecasting Reversal Zones.
One of the primary, easiest ways to use pivot points is to identify potential reversal points. Like this:
• If the market opens above the central pivot (P) and moves toward R1, it will likely reverse from there (especially if volume or momentum starts fading).
• If the market is falling toward S1, and the price starts to consolidate, or you start to see bullish candles forming, then that S1 level may act as a support bounce.
These reaction levels typically align with psychological levels, where buyers or sellers take action.
2. Planning a Breakout or Continuation Trade
Additionally, pivot levels may not always act as barriers. If the price breaks out of a pivot with conviction, that pivot level often flips its role:
• A break of R1 may lead to a move toward R2.
• A break below S1 might create a move toward S2.I
In these situations, pivot levels act as forecasting landmarks: when one level is broken, the next level will become your likely target.
3. Setting Daily Bias
The central pivot (P) is often used by many traders as a directional filter:
• When the price is trading above the pivot, they are interested in being long (buying)
• When the price is trading below the pivot, they are interested in being short (selling)
This allows for removing a lot of "noise" and "emotional" decisions. You are no longer trying to "catch every move" but instead trading with a systematic bias.
Utilizing Pivot Points with Complementary Tools
While pivot points have a lot of strength individually, they also have a lot of additional strength when combined with:
• Candlestick patterns (like pin bars or engulfment candles)
• Trendlines and chart patterns
• Volume
• Moving averages (for example, if the price is bouncing at R1 and 50 EMA)
For example, if the price hits S1 and forms a hammer candle with increasing volume, that would be a primary reverse signal. Or if price breaks R1 and then retests it as support, that would almost be a classic continuation setup.
Pivot Points on Other Timeframes
You do not have to be a day trader to begin using pivot points. Pivot point can be calculated on multiple time frames:
• Daily pivots: They can be used for intraday traders or short-term swing trades
• Weekly pivots: Can be helpful to swing traders and position traders
• Monthly pivots: Can help in determining a larger trend zone or longer-term support/resistance.
One very effective method that many professional traders use is multi-timeframe analysis. For instance, if you had a daily price that opened above the pivot (P), and then the price pulled back and touched the S1 along with the weekly pivot, that zone becomes a robust area.
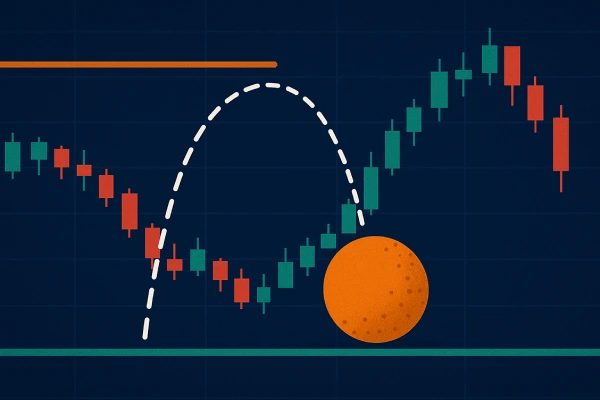
A Real World Example - Predicting A Bounce
Let's place the EUR/USD. The instrument opens the day above the pivot level (P). As the day unfolds, the price goes lower over time and eventually contacts the S1. At this moment you will see:
• RSI is moseying into oversold territory
• A bullish engulfing candle is unfolding
• Volume is slightly increasing
All of this information is telling you that S1 could likely act as support, which puts you in a high probability zone to bounce. You go long with your stop below S2 and a target just below the pivot or R1.
Even if the trade does not pan out, at least you were prepared with a valid reason to enter a position, a logical stop, and a structure to base your decision upon rather than a random guess.
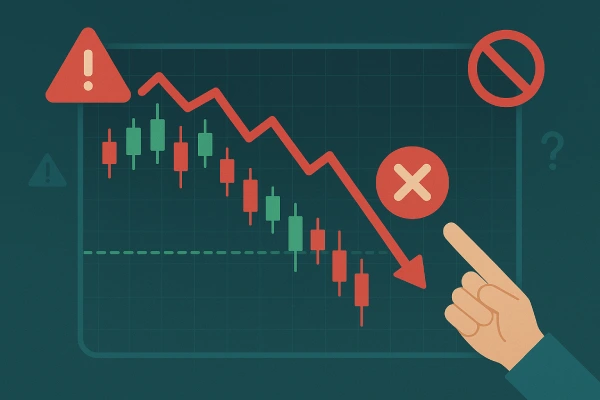
Mistakes to Avoid When Using Pivot Points
Here are four common pitfalls to avoid with pivot points:
Trading every level thoughtlessly - Not every R1 or S1 touch is a trade signal on its own. Consider the context and confirmation.
Forgetting about the trend - Do not trade counter-trend reversals unless you have a strong setup.
Overcomplicating the chart - Pivot points are designed to simplify charts, not muddy the waters. Do not overcrowd your charts.
Overlooking news catalysts - Pivot levels may just be ignored during crucial announcements.
How to get started today
If you are new to the concept of using pivot points, here is a step-by-step process you can follow:
Pick one market you're very familiar with (e.g., EUR/USD, S&P 500, Bitcoin)
Enable pivot points plug-in or functionality on your charting platform (most commonly used platforms like TradingView or MetaTrader have them)
Observe how the price behaves at these levels over a week
Start journaling your observations and recording how many times levels hold, which ones break, and what confirmation signals show up
Start to test little trades with targets and stops that are based on the pivot logic
Conclusion:
Pivot points will never turn you into a market wizard; however, they will give you a structured approach to view price movement. In time, you will develop the ability to start forecasting with logic, leadership, and confidence - versus running around trying to chase trades and later reacting with your feelings!
Professional traders don't always get it right—but they always have a reason for their trades. Pivot points provide that reason: a clean way to plan and anticipate where the market might stall, turn, or accelerate. Whether it's a day trade or a swing position, we want to be proactive—not reactive—when trading using pivot points.
The next time you sit down to review a chart, don't just ask yourself what's going on. Ask yourself where the market might go next—and why? Pivot points may provide you with the answer.
Continue Learning
What's Next?
Keep building your knowledge with our structured learning path. Each section builds upon the previous one.
This is the first section
You're at the beginning of your journey!
This is the last section
You've completed this course!