
Select your preferred language
Language changes will apply immediately
Select your preferred language
Language changes will apply immediately
Rectangle Patterns in Trading: A Complete Guide for Traders
"Learn all about rectangle patterns, how they happen, and ways to profitably trade strategies to identify breakouts and take advantage of the market trend. "
Wikilix Team
Educational Content Team
Have you ever seen an asset in a powerful trend, only to have it suddenly stop and start trading sideways? The price levels seem to bounce up and down in a box, and traders may be wondering: "Is the trend now over and we're in a pause-mode, or are we just biding time before moving onward higher?"
This sideways price action is the rectangle pattern, which can produce plenty of opportunities for traders who know how to follow it, because chop can be very rewarding! By the time you finish reading this article, you will learn how rectangle patterns form, their psychology, and how to trade them through continuation and reversal strategies. Let's get started.
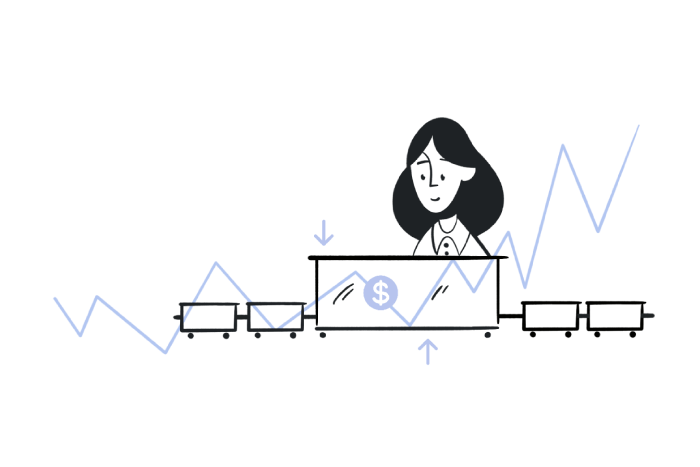
A rectangle pattern is a period of consolidation, where price channels back and forth between horizontal prices of support and resistance. The price levels of the highs and lows of a rectangle pattern are very defined. The rectangle pattern shows a box on the price level.
The range of prices that the price has been channelling up and down between in a rectangle pattern indicates a temporary balance between buyers and sellers in the price action of that particular instrument. A rectangle will form instead of the typical irregular zig-zag pattern because there is a pattern to the price action.
Each time the price moves towards the top of a box, the sellers come in. Each time it moves toward the bottom of the box, the buyers come in! Eventually, the battle for price to stay bound within a rectangle pattern continues until it can no longer, and breaks out to the top or bottom level in a rectangle.
Look for these characteristics when defining a rectangle:
Clearly marked support and resistance levels: Price has respect for two parallel horizontal lines of support and resistance.
Multiple touchpoints: Rectangle patterns should be drawn with at least two touches at the upper price and lower price to display that it is a confirmed pattern
Length of rectangle pattern: a rectangle pattern can last for a short duration of days, weeks, or even months, depending upon the time frame of the trade.- Volume behaviour: Diminishes in the rectangle, and increases on a breakout.
Not all rectangles mean the same thing. The rectangle's meaning is entirely dependent on the factors and trends that preceded it.
Even though the rectangle is formed in an uptrend, it can be viewed as a pause before going higher. At this point, the buyers are building their energy, and typically they will go higher after the breakout past the resistance.
When the rectangle is formed in a downtrend, it usually indicates some simultaneous weakness. This suggests that the sellers are strong, and once the consolidation area concludes, a break of the previous support level occurs, confirming the ongoing bearishness. When the rectangle marks the consolidation area, setting up the downward trend, it signals weakening optimism.
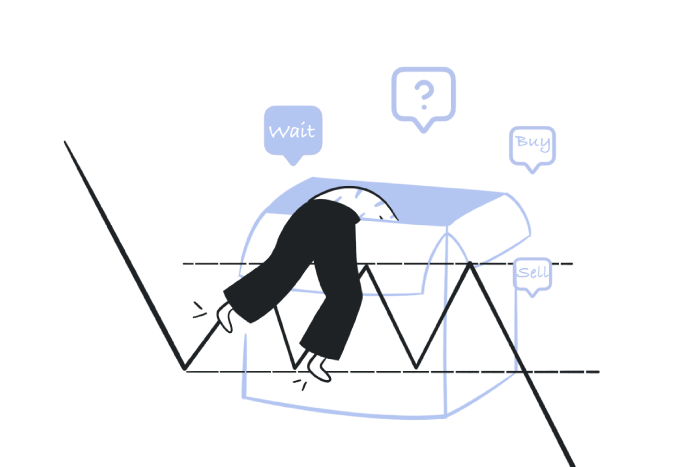
Some rectangles will mark the end of a trend (exhaustion phase). Therefore, a downward trend can pause in a rectangle and then start to trend in the opposite (reverse) direction (upward). Conversely, a rectangle can also mark the consolidation area before reversing the price direction downward. In both cases, and before acting on the reversal, you will need to have further confirmation.
With rectangles, it's more than just drawing rectangles on a chart; there are also psychological reasons for it to occur in a market.
• At resistance, you have sellers thinking the price is too high, and they start to unload their position.
• At support, you have buyers thinking the price is cheap, and they start to buy.
• In the middle, you have uncertainty, which results in choppiness.
• Eventually, one side gains enough confidence to push the other side and creates strong momentum... ideally in the direction of the breakout, often a lot.
In essence, rectangles represent a level of indecision that will eventually be resolved.
Some traders will trade the sideways action itself. Whenever the price is near the support line, they will buy, and when it nears the resistance line, they will sell. They will repeat this process until the price breaks out of the rectangle, either up or down. This strategy works best when the rectangle is long with clear support and resistance lines.
The most common method to trade a rectangle is to wait for a confirmed breakout.
- Upward breakout: After the price has broken through the resistance line, go long above the resistance.
- Downward breakout: After the price has broken below the support line, go short below the support.
The typical price target is the height of the rectangle. Calling it a height is misleading, as you don't get height out of a rectangle. Measure the distance between the two lines, which would be the support and resistance levels, then project that distance from the breakout point.
The main thing to keep in mind is that you are protecting yourself with stop-loss orders:
- For upward breakouts, put your stop-loss order just below the rectangle itself.
- For downward breakouts, place your stop-loss just above the rectangle.
- Jumping in prematurely: This is an all too common occurrence. Remember that false breakouts happen with relative frequency, so you want to wait for the candle to close beyond the line.
- Ignoring volume: If the price breaks out, but the volume is not there to support it, then these trades may lack conviction.
- Ignoring the trend: A rectangle that forms in an uptrend is more likely to breakout to the upside, and vice versa.
- Over-trading inside the range: The risk-reward package for a rectangle trade isn't great. If you buy and sell it every time it moves one pip, it could lead to whipsaws.
Finally, a rectangle often gets confused with flags, pennants, or triangles. The key distinctions?
- A rectangle is formed with horizontal support and resistance lines.
- A flag and pennant pattern is generally sloped/moving in one direction or converging after a sharp move.
- A triangle is when the two lines converge towards a point.
These differences help avoid misinterpretation of the chart patterns and will help you focus your trading strategy.
Let us say a stock rallies from $50 to $60 and gets stuck there. For the next three weeks, it oscillated between $58 and $60 at the top, and $55 and $56 at the bottom. This is a rectangle.
If the stock finally breaks out above $60 and the volume is substantial, a stock trader could then buy shares at $61. They know that they'd have to put their stop at $57 and set their price target at $65 (which is the rectangle's $5 height added on to the breakout level).
- Zoom out: On your charts, it is always a good idea to check the higher time frames to confirm the overall trend
- Combine rectangular patterns with indicators: Use indicators like RSI, moving averages, or MACD to confirm momentum.
- Be patient with consolidations: Consolidations can take a more extended amount of time than you think.
- Risk management first: Remember that even the most textbook patterns can fail—always protect your capital!
The rectangle pattern might come across as dull or simplistic, but that is where the beauty is. The rectangle reflects when the market is resting, weighing options, and building energy to break out in the next direction.
• In an uptrend, rectangles frequently act as a short-term, bullish pause.
• In a downtrend, the rectangle is typically a continuation of the downtrend and bearish.
• Most of the time, it acts as a turning point, as long as you wait for confirmation.
When you learn to identify and trade rectangles, you give yourself a whole new tool to use in trading! Always remember: it's not about knowing what's going to happen with certainty, it is about being diligent and managing probabilities. The next time you are looking at a price stuck in a box on your charts, it's really an opportunity waiting to break out.
Keep building your knowledge with our structured learning path. Each section builds upon the previous one.
This is the first section
You're at the beginning of your journey!
This is the last section
You've completed this course!
20 min
Reading time
Beginner
Difficulty
