
Select your preferred language
Language changes will apply immediately
Select your preferred language
Language changes will apply immediately
RSI for Reversal Signals
"Find out how to use the RSI indicator to identify potential reversal signals to enhance your trading plan. Plus, gather helpful tips, strategies and examples to make better decisions."
Wikilix Team
Educational Content Team
Have you ever taken a trade only to see the price reverse only moments later?? You're not alone; recognising market reversals is one of the hardest things for most traders. The Relative Strength Index, or RSI, can help you in this regard.
Not only is the RSI a momentum indicator when used most appropriately, but the RSI can also present traders with a lot of clues regarding potential reversal signals, before those signals actually appear. In this article, we'll cover how RSI works, why it is essential for traders, and how you can use it to identify turning points with more conviction.
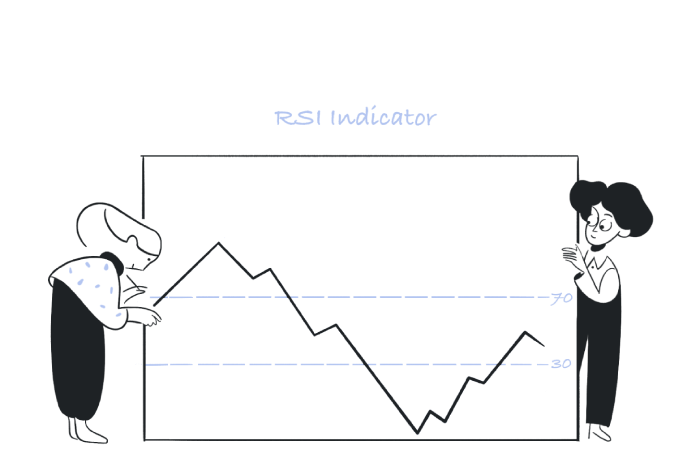
The Relative Strength Index (RSI) is a momentum oscillator that has been developed to measure the rate and change of recent price movements. The RSI moves between 0 and 100, and can be helpful for traders to gauge overbought and oversold conditions:
• Above 70=Overbought, and possibly setting up to reverse downward.
• Below 30=Oversold, and possibly setting up to reverse upward.
The RSI is calculated by taking the average of up closes versus the average of down closes over an established look-back period (typically 14 periods). While the math happens in the background, what matters for us as traders is knowing how to read the RSI and then be able to make interpretations of the signals.
The RSI works well at identifying reversals because it captures momentum shifts ahead of when the price displays a change. Markets do not typically move in straight lines, but instead fluctuate somewhat uniformly within extremes.
The RSI indicates these extremes, which allow traders to identify points in time when price momentum is decreasing potentially. For instance, if the RSI continues to rise above 70 and the price is increasing, the RSI would indicate that momentum may be decreasing (conversely, the price is currently making a rally).
The same can be said when the RSI closes below 30; that sellers may also be decreasing momentum - less selling and/or realising the trend will turn back up.
A simple way of using RSI is to consider its classic trendlines.
• Overbought (>70): Will want to implement tighter stops, but start taking profits and prepare for possible reversal.
• Oversold (<30): Look for buying opportunities or prepare for a possible bullish reversal.
Use these levels and strategy, as levels should not be used as a stand-alone strategy. Just remember to confirm!
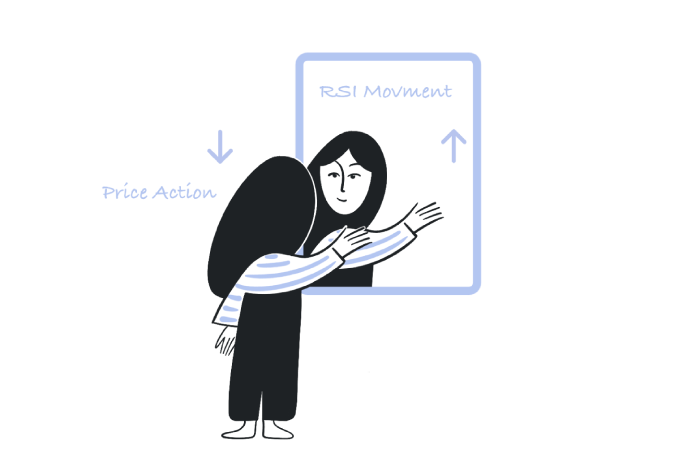
Divergence is when the price action moves in one direction while the RSI moves in the other direction (example below). Divergence is a powerful pre-warning sign for classifications of reversal:
• Bullish Divergence: Price action makes lower lows while RSI makes higher lows. This impulsive buying of the stock is significant! (The price action indicates that this selling activity is beginning to slow.)
• Bearish Divergence: Price action makes higher highs while RSI makes lower highs. It means aggressive buying ahead, with the top indicating that this momentum may wane and possible price declines as a risk.
If both of these divergences can be observed - aggressive selling/buying occurs, the divergence could give you enough advantage over other traders who are only considering price, RSI Failure Swings.
A failure swing occurs when RSI reaches overbought or oversold conditions but cannot maintain its momentum and reverses direction:
• In an overbought failure swing, RSI surpasses 70, prices fall back, prices again try to rise, but RSI does not make a new high before it heads lower.
• In an oversold failure swing, RSI dips below 30, RSI springs back up, tries to retest the low but does not make a new low before it begins to rise.
Often, these types of setups serve as strong confirmations of a reversal.
RSI will provide the best results when used with other technical tools to minimise false signals and increase the accuracy of your signals.
• Support and Resistance - when RSI reaches the overbought range, combine that with the high near a significant resistance zone, which will more likely result in the price reversing.
• Candlesticks - combine RSI readings with candlestick patterns such as engulfing candles and dojis to provide greater probabilities of success.
• Trend indicators - you can combine RSI with moving averages or trendlines to provide even greater confidence to evaluate whether the price is making temporary pullbacks or actual price reversals.
This will help filter noise and build more assurance in each signal.
The default settings for RSI (14-periods) work for many assets; however, each market will have different characteristics. Being able to adapt RSI for other conditions will potentially produce better results:
• Day Trading: for day trading, you will want to apply timeframes that are shorter than the default ( i.e. 7 or 9), you will generate quicker signals and more responsive signals.• Swing Trading: Utilise the standard 14-period timeframe for medium-term reversals.
• Long-term Investments: The longer the period, the less noise and the more significant the reversal period.
When you customise RSI to your system, it becomes a more effective and personalised experience.
RSI can be potent, but it isn't perfect. Here are common mistakes to avoid.
• Too early: Don't trade strictly because RSI hits 70 or 30 levels, wait for price confirmation.
• Missing trends: RSI could stay above 70 levels for very long periods during strong uptrends. Or stay below 30 levels during downtrends. Context is everything.
• Too many indicators: Using RSI with too many conflicting indicators can result in analysis paralysis. Keep it simple with just enough indicators that help you make sense of what you are seeing.
Knowing the boundaries of RSI will enable using it wisely, not unquestioningly.
Suppose we have a stock in a perfect uptrend and breaking through all resistance levels. RSI then creeps above 75, creating a lower high, while price makes a higher high. This is a bearish divergence that indicates momentum is slowing down while price keeps climbing.
There could be traders who are watching RSI closely and tightening their stop-loss, or in fact getting out of their position right before the stock reverses, thereby averting losses, while others are caught unaware.
RSI does not measure solely numbers but the identity of the trader's psychology. Overbought suggests that exhaustion in buying trend enthusiasm, whereas oversold suggests exhaustion in panic selling. Knowing that there is a behavioural aspect to RSI helps traders determine the space between the facts and react before the masses.
The Relative Strength Index is a compelling way to show potential reversal signals. As with any indicator, it's most effective when taken into consideration. When combined with levels of RSI, divergence, failure swings, price action, and other confirmations, you can start to make intelligent, confident decisions.
RSI does not predict the future; RSI helps read the momentum of the market, and algorithms help identify signs of sentiment shifting.
With practice and discipline, the RSI can become one of your most trusted allies for identifying turning points and helping keep you ahead of the curve.
Keep building your knowledge with our structured learning path. Each section builds upon the previous one.
This is the first section
You're at the beginning of your journey!
This is the last section
You've completed this course!
14 min
Reading time
Beginner
Difficulty
