
Select your preferred language
Language changes will apply immediately
Select your preferred language
Language changes will apply immediately
Ultimate Guide to Stochastic Oscillator: Trading Signals & Strategies
"Find out what the Stochastic Oscillator is, how it works, and how to take advantage of this popular momentum indicator to help find trend reversals and trading opportunities."
Wikilix Team
Educational Content Team
Have you ever looked at a chart and thought, Is this new price action legitimate or just a bump in the road? The Stochastic Oscillator works like an experienced coach who advises, "Hold up, it could be too early to score".
Not only does the Stochastic measure overbought/oversold levels, but it also gives you a sense of when price momentum has slowed or started building. Please stick with me to see how a deceptively simple oscillator can improve your trading instinct and bring some order to many chaotic charts.
The Stochastic Oscillator is a momentum indicator that compares a security's close price with its price range over a specific period. Essentially, it shows how "fast" or "slow" price movement is relative to recent price activity.
The Stochastic Oscillator is presented as a chart of two lines that oscillate between the range of 0 and 100. It provides intuitive signals to the trader, making it understandable for those who know what to look for.
Here is how it is constructed:
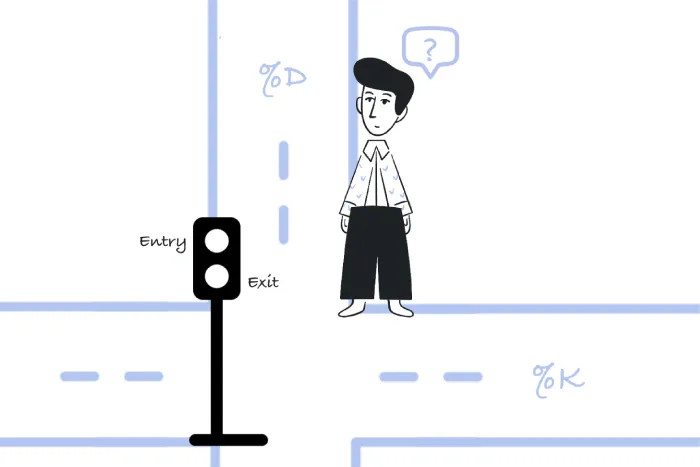
• % K Line: This is the raw indicator that shows where the current close price is relative to the high-low range over X periods (commonly 14).
• % D Line: This is a smoothing of the % K plans, which is usually a 3-period moving average.
In summary, the formula shows how close today's close price is in relation to the most recent high-low range. Then, when plotted together, they, as momentum indicators, will highlight shifts in momentum with areas of possible reversals.
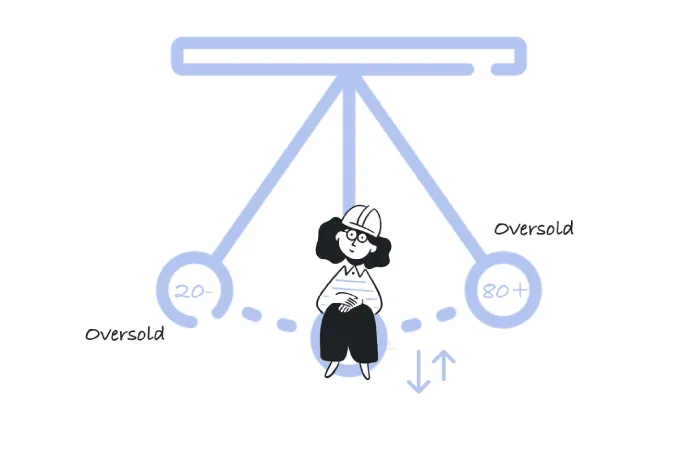
• If the oscillator has readings above 80, they may might and the market may also be in an overbought state - likely due for a pullback.
• If the oscillator has readings below 20, they may be indicating a move, and the market may also be in an oversold state - usually a bounce opportunity.
• When the %K line crosses above %D in lower zones, that would indicate potential upward momentum.
• When %K crosses below %D in higher zones, that may be an indication that we are now moving downwards.
• Bearish Divergence: The price makes a new high, but the oscillator does not - likely indicating momentum is fading.
• Bullish Divergence: The price makes a new low WITHOUT hitting a higher "lowest" reading on the oscillator - likely indicates a possible reversal North.
Some traders should keep their eye on the 50 line, as a %K or %D reading above that line is supportive of a continued bullish tone. In contrast, a signal below may be developing a downward trend.
The default set-up is 14 periods for %K +3 periods for %D, and it works beautifully across many different markets, but don't be afraid to play:
• Shorter: periods = boosts;
• Longer: periods = smoothes / reduces;
What is satisfying to you is finding ways to align your trading style with your goals - whether you are day trading, swing trading, or longer-term position trading.
Be alert for instances of %K that dip below 20, and then cross back over %D - that could be your signal to enter long. The same approach is taken at the top when %K retreats from above 80.
Only about half of divergences actually develop into divergence reversals, but pairing one with price action (support/resistance) increases your confidence a lot.
In strong trends, overbought/oversold signals may be misleading. Instead, be on the lookout for one crossover from the middle area to help identify when momentum has shifted; it's almost like focusing on reading the engine, rather than worrying about scratches on the dashboard.
Stochastic often performs better when used together with:
• Moving averages and price action to track trend directions.
• Volume as a way to measure the strength of a breakout.
• Price patterns, like a candlestick signal or drawing trendlines, for example, a stochastic signal as trend support is rising, are more compelling.
Strengths:
• Visual and intuitive - very effective for identifying changes in momentum.
• Works universally - you can use it on stocks, forex, crypto, and commodities.
• Identifying reversals and analyzing trend strength.
Limitations:
• When the market is in a powerful trend, signals can become embedded into the overbought/oversold signals for longer than anticipated (do not unthinkingly counter-trend).
• False signals during sideways movements are relatively frequent.
• It should be viewed as part of a larger trading system, and not as one sole indicator.
The beauty of the Stochastic Oscillator is that it so seamlessly fuses momentum signals and reversal signals at a glance. It is a universal representation, featuring two moving lines that travel between 0 and 100, clearly exhibiting threshold points suitable for beginners while remaining multi-purpose for experienced traders.
Regardless of whether you are identifying divergences, recognizing signs of exhaustion, or trying to find the perfect price you need for a short entry or a long entry, it helps to create actionable insights, without being tied up by a multitude of indicators competing for your attention.
Here is a quick summary of how to manage this momentum tool:
• If you are above 80 - potentially overbought - proceed with caution.
• If you are under 20 - potentially oversold - stay alert for a bounce if you want to trade.
• Crossovers are your first signal - be mindful not to act in isolation from the market context.
• Divergences are your alert signal that can come before significant moves.
• Always confirm using other techniques - price action, price patterns, volume, etc.
• You can adjust the settings to suit your comfort, and your timeframe, etc.
In the proper context, the Stochastic Oscillator becomes less of an indicator and more of a trusted friend - a great momentum-related friend that whispers clues to you when the market becomes too noisy. Let it work for you, simplify your decisions, and clarify your entry confidence.
Keep building your knowledge with our structured learning path. Each section builds upon the previous one.
This is the first section
You're at the beginning of your journey!
This is the last section
You've completed this course!
13 min
Reading time
Beginner
Difficulty
