
Select your preferred language
Language changes will apply immediately
Select your preferred language
Language changes will apply immediately
Triangles (Ascending, Descending, Symmetrical)
"Everything you need to know about triangle chart patterns: ascending triangle patterns, descending triangle patterns, and symmetrical triangle patterns. Understand how to recognize if triangles are forming, how to incorporate them into a trading plan and potential breakout targets."
Wikilix Team
Educational Content Team
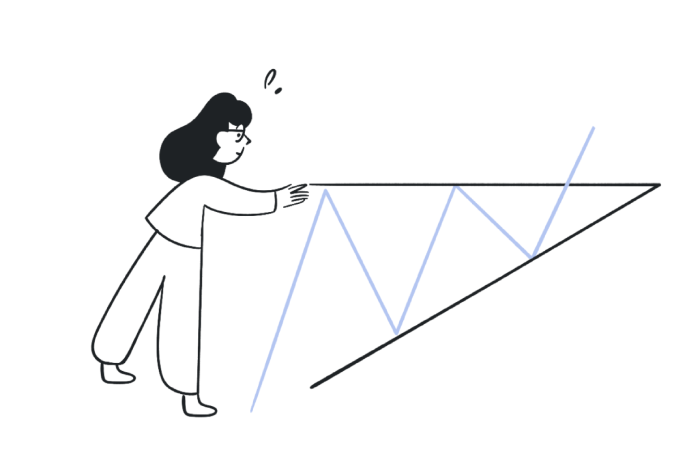
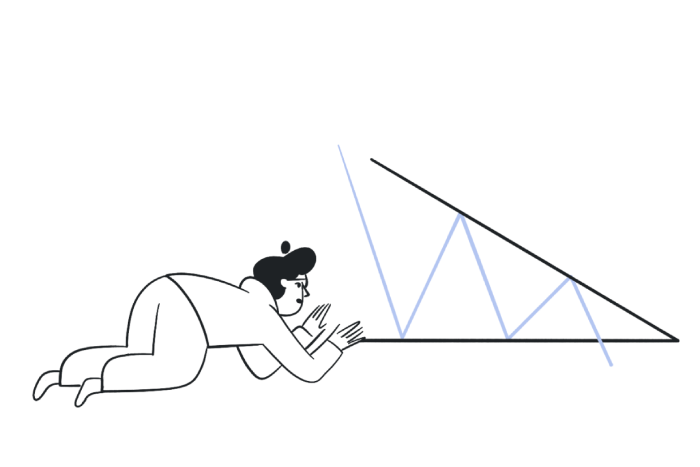
Picture this: you are browsing a price chart and notice the market has started to slow down. The price is trading within narrowing bounds, creating two lines that are getting closer together. Then suddenly, the price breaks out of these two lines and starts moving sharply in one direction. What just happened?
This is the beauty of triangle chart patterns. Traders can use these patterns to watch for potential breakouts and make more informed trading decisions.
In this article, we will explore ascending triangles, descending triangles, and symmetrical triangles, examining their characteristics, how to identify them, and the strategies for utilising and implementing these patterns. Whether you are new to trading or are an experienced trader, learning to recognize and use stability triangles can place you at a competitive advantage.
The ascending triangle is identified as a bullish continuation pattern and is typically seen in an uptrend. An ascending triangle pattern occurs when the price of a security forms a horizontal line of resistance at the top boundary, while the lower trend line slopes higher.
This pattern shows that there was increased buying pressure. The buyers were trying to push the price downwards, but the sellers were stepping in and absorbing all the selling pressure each time at higher price levels, which is why we see the first peak to be higher than the previous low. The line of resistance is identifiable as a ceiling that has been holding the price back on its upward ascent.
Usually, once the price breaks out above the ceiling of resistance, which is typically accompanied by substantial volume, we can expect a significant move. Traders view this breakout as a signal that buyers are in control of market sentiment, and traders will be in a position to play the bullish move.
The descending triangle is, for all intents and purposes, the mirror image of the ascending triangle. The descending triangle occurs in a downtrend, signalling traders that they are likely continuing in a bearish manner. The line of support at the bottom is flat, while the upper trendline is downward sloping.
The formation indicates increased selling pressure, as buyers' attempts to push the price up have been met with aggressive selling, resulting in lower highs. Consequently, the price has consolidated against the support level.
When the support level gives way, the breakdown will likely present a decent move further below. Since volume in these patterns is low, others will typically wait for an increase in volume to trade against the breakout price in trust.
Traders will normally try to find the opportunity to make or solidify a trade in anticipation of further follow-through from the initial breakdown.
The symmetrical triangle shows us a period of consolidation where buyers and sellers are equal. The two trendlines are sloped inward, creating a cone shape, while the price is bouncing between higher lows and lower highs.
The symmetrical triangle is considered a neutral pattern, which advises traders that a breakout could happen in either direction. However, the breakout should come in the direction that the trend was in up until the pattern formed.
Since symmetrical triangles are not as predictable as ascending and descending triangles, traders will usually wait for a breakout before being able to make a trading decision. A spike in trading volume, along with a strong close above one of the trendlines, is typically a good indication that momentum is establishing a trend.
Recognising triangle patterns can be a challenge at first, but soon it will become second nature. Here are a few tips for identifying triangle patterns with confidence:
In ascending triangles, the top trendline is horizontal, and the bottom trendline is ascending. In descending triangles, the bottom trendline is horizontal and the top trendline is descending. In symmetrical triangles, both trendlines are converging and descending at the same rate.
The price action ideally should touch each trendline at least twice to establish clear boundaries of the pattern.
Trading volume usually declines through consolidation while developing a triangle. A significant volume spike during the breakout typically validates the breakout.
Occasionally, the price action will breach a trendline and then reverse immediately. Wait for clear momentum by confirming there's a strong candle close past the trendline, and confirm stronger-than-normal volume breaks down through the triangle's base.
Triangle patterns can provide tremendous returns when traded correctly, but require patience and discipline. Here's what traders do:
a) Trade the breakout
• For an ascending triangle: place a buy order above the resistance and take the position once the price has closed above that level.
• For a descending triangle: place a sell order below the support line and take the position once the price breaks through that support line.
• For a symmetrical triangle: be patient. Wait for trigger confirmation in either direction to avoid Betsy Ross wanting to stitch you in the triangle.
b) Price targets
Take the widest part of the triangle and project it from the breakout to determine a more realistic price direction.
c) How to manage risk
Always place your stop loss just inside the opposite side of the triangle. For example:
• For the breakout of an ascending triangle, your stop loss is typically under the last swing low.
• For the breakdown of a descending triangle, your stop loss is typically just over the last swing high.
d) Things NOT to do
• Never presume the direction of the breakout until it happens, particularly with symmetrical triangles.
• Do not chase the price after the breakout; wait for confirmation.
• Always make sure you are trading triangle positions in the same direction as overall market movements to help provide you with a higher probability set-up.
A triangle is not just a notation on a chart; it gives us meaning with respect to the mindset of the market participants.
• An ascending triangle hints at buyer strength.
• A descending triangle illustrates seller control.
• A symmetrical triangle is essentially a momentum rest where two opposing forces are fighting it out to the end.
This understanding enables the trader to predict, rather than react late to, a significant price move in the market.
Triangle patterns are one of the most flexible and universally used patterns in technical analysis. They capture indecision in the market and provide clues for potential breakouts.
To recap:
• Ascending triangles often indicate bullish continuation.
• Descending triangles generally represent bearish continuation.
• Symmetrical triangles are neutral, but typically break in the direction of trend continuation.
That said, there is no specific pattern that is an absolute. Always confirm breakouts with volume, manage your risk, and be aware of the broader trend.
Mastering triangle patterns is not about identifying shapes, but more so about understanding the equilibrium between buyers and sellers. Once you establish this understanding, these setups can become an effective part of your trading edge.
Keep building your knowledge with our structured learning path. Each section builds upon the previous one.
This is the first section
You're at the beginning of your journey!
This is the last section
You've completed this course!
15 min
Reading time
Beginner
Difficulty
