
Beginner
Understanding and Applying Support and Resistance Effectively
Understanding and Applying Support and Resistance Effectively
"Support and resistance are more than just lines to draw on a chart. Get to know how to find and use them effectively to identify trend direction, better entry points and ultimately become a better forex trader."
Wikilix Team
Educational Content Team
July 29, 2025
15 min
Reading time
Beginner
Difficulty
#learningwave#MasteringSupportamdresistance#forex

Have you examined a price chart and wondered why the market appears to bounce off certain levels? If the market can get "stuck" at some prices, why does it shoot up or down past others? The market is like our universe. There are patterns everywhere; invisible forces conceal them. Support and resistance are two of the most potent forces in the market. Recognizing those levels and, more importantly, utilizing these forces, can change your trading portfolio from random habits to a strategic practice. Whether you are a new trader or looking to refine an existing strategy, support and resistance will eliminate the guesswork from trading and help you understand what to expect in the markets, providing clarity and confidence.
What is Support and Resistance?
At its simplest:
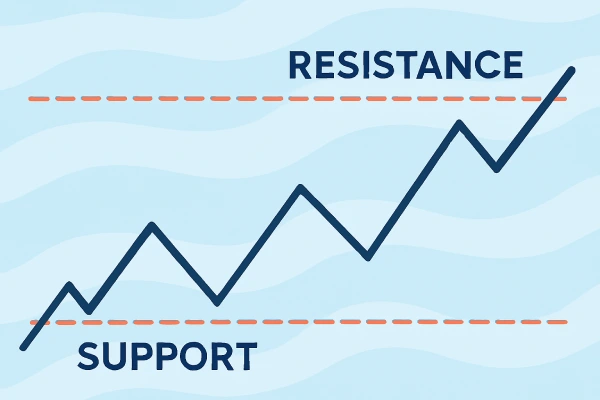
• Support is a price level at which a falling market shows indications to stop and reverse.
• Resistance is a price level at which a rising market shows indications to pause or stop falling.
In this perspective, you may view support as the floor and resistance as the ceiling; therefore, the price bounces off the floor/ceiling. At the support level, buyers step in and apply upward pressure when the price reaches them. At the resistance level, sellers step in and apply selling pressure, which pushes the price down.
These levels are not set in stone. They are areas rather than exact lines. Price can dip below support or rise above resistance a little before reversing; therefore, flexibility is essential.
Why Support and Resistance Are Important
Support and resistance are psychological areas. They are formed by human behavior; as people will remember specific price points from the past and will act on them.
Here is why they are essential:
• Entry & Exit: They are there to help a trader determine when to enter or exit a trade.
• Risk Management: Support and resistance are great places to place stop-loss orders or define risk areas.
• Trend Confirmation: When we break a resistance, it can become support (and vice versa). That flip can add strength to trend continuation.
When you use them correctly, you are trading with structure, not emotion.
Types of Support and Resistance
Support and resistance can take many forms and shapes. Here are the most likely:
1. Horizontal Levels
These are the standard, clean lines in price, where multiple reversals at that price have occurred in the past. These are easy to notice and highly reliable, especially on higher timeframes.
2. Trendlines
Trendlines are used as dynamic support and resistance. A trendline drawn below the price in an uptrend acts as support, and a trendline drawn above the price in a downtrend acts as resistance.
3. Moving Averages
Moving average indicators, such as the 50-day or 200-day moving average, can serve as support or resistance in trending markets. Traders often watch moving averages and develop trading strategies based on how the price interacts with these averages.
4. Fibonacci Levels
Using Fibonacci retracement tools, Fibonacci levels can indicate potential support and resistance zones based on mathematical ratios (e.g., 38.2%, 50%, or 61.8%). Fibonacci levels can help predict where the price may react when it is pulling back.
5. Psychological Numbers
Some naturally occurring numbers, such as a round number of 1.2000 in EUR/USD or 150 in stock prices, can also provide support/resistance areas, as large volumes of traders closely watch them.
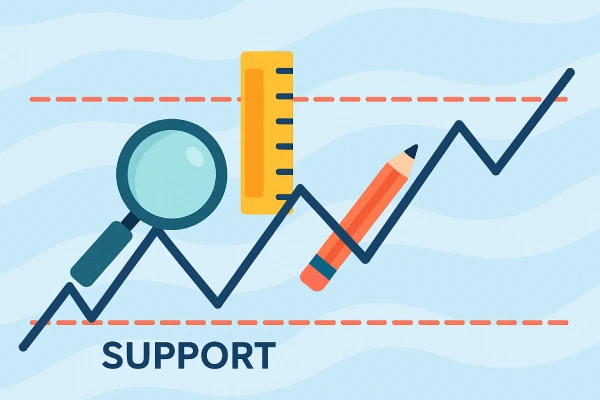
How to Find Key Levels
Finding support and resistance can take time to get proficient, but the following will help:
• Look Left: Always look at the historical price action of the pairs you are trading. If the price has bounced several times from that level, then you should give it significance
• Volume Confirmation: Areas of key support or resistance often occur where there has been a high level of volume because so many traders are looking at the same area as either support or resistance as a whole.
• Wick Rejections: Wicks on candles that get rejected several times from either support or resistance indicate strong support or resistance to trading price action.
Trendlines serve as active support and resistance. In an uptrend, the line drawn under the price acts as support. In a downtrend, the line drawn above the price acts as a resistance level.
Common Trading Mistakes
Even the best traders can screw up their trades around support and resistance. That being said, here are some common mistakes to avoid:
❌ Treating Levels as an Exact Price - Always think of them as zones, rather than exact lines.
❌ Not Taking Context Into Account - A support level on a 1-minute chart means very little against a trend on a daily chart, for example.
❌ Forcing Levels to Fit Your Bias - Just because you would like to go long does not mean that a random dip is "support". The market isn't very concerned about what you want.
❌ Overcomplicating Your Chart - Too many lines can make your thoughts convoluted. Keep only the most relevant levels on your chart.
Support and Resistance in Conjunction with Other Tools
Support and resistance work best when used in conjunction with other tools and methods of analysis:
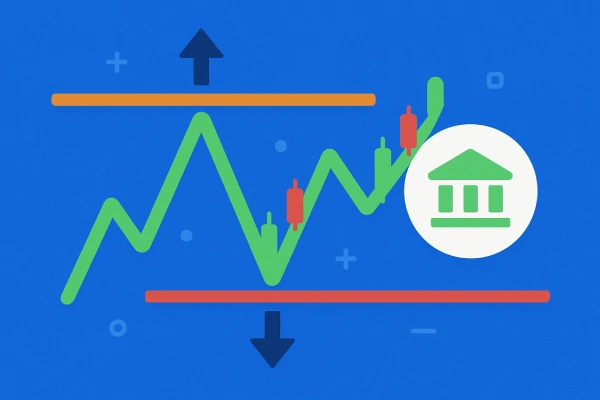
• Price Action - Getting confirmations from candlestick patterns at support/resistance levels can be critical.
•Indicators - The confirmation and strength to signal from tools like RSI, MACD, or Bollinger Bands can give you extra credibility.
•News & Events - Avoid trading on technicals when there could be major news or high-impact volatility (for example, interest rate decisions) that can break support or resistance mesmo u5uj.
•Volume Analysis: Significant volume near key levels can confirm the validity of the levels.
Practical Example: Support / Resistance in Action
Suppose EUR/USD is approaching a level that has acted as support three times in the past. As the price approaches this area again, you notice a bullish engulfing candle forming on the 4-hour chart.
Once the candle closes, you proceed to go long
You put on a stop loss just below the support zone to properly manage your trade
You target a nearby resistance level as your profit-taking area.
This straightforward and structured trading idea is based on support and resistance levels.
Conclusion:
Support and resistance are two of the oldest, but most powerful tools when trading. They indicate real market psychology — where buyers and sellers previously came together, and also where they will likely do so again.
When you become proficient at defining, interpreting, and using these levels, you can make a more confident decision in the forex market. You may not win all your trades, but you will understand why the market behaves the way it does, and that understanding is what distinguishes the smart trader from the rest.
Support and resistance are key tools in technical analysis that help traders identify potential entry and exit points. Understanding and applying them effectively can lead to smarter, more strategic trading decisions in any market.
Continue Learning
What's Next?
Keep building your knowledge with our structured learning path. Each section builds upon the previous one.
This is the first section
You're at the beginning of your journey!
This is the last section
You've completed this course!