
Select your preferred language
Language changes will apply immediately
Select your preferred language
Language changes will apply immediately
Using Pivot Points for Range Trading
"Understand how to apply pivot points to range trading and capture support and resistance levels. Learn how to trade sideways markets confidently."
Wikilix Team
Educational Content Team
You're staring at the screen, and the price is bouncing back and forth between two levels endlessly, which feels frustrating, correct? Could you leverage a few math indicators to help you get the proper entry and exit levels and make indecision an opportunity?
\Pivot points can absolutely provide this! Please stick with me while I show you how to apply these calculated levels to build confidence, treat bounces as trades, and feel good about the indecision of the price moving around like a ping pong ball.
Pivot points are calculated price levels based on the previous day's high, low and close. Instead of chasing trends that are not taking place, range traders can use these levels as a reliable guide. Typically, some sideways market-moving price reacts to support (lower pivot levels) and resistance (upper pivot levels), and that is where these levels come alive in your strategy.
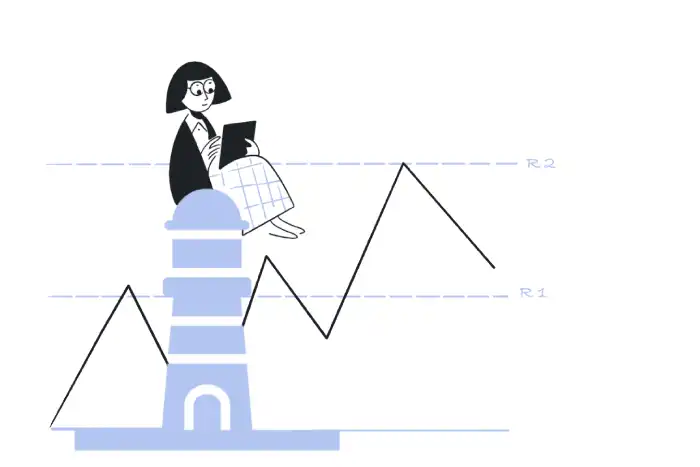
First, take the traditional formula construct:
• Pivot (PP) = (High + Low + Close) ÷ 3
• Support 1 (S1) = (2 × PP) – High
• Resistance 1 (R1) = (2 × PP) – Low
• Support 2 (S2) = PP – (High – Low)
• Resistance 2 (R2) = PP + (High – Low)
Now you have a price in between S1 and R1, possibly a range environment. Use the lines like car paddles—play the bounce, not the breakout (unless you clearly have a breakout)
First, here is what to look for:
• Repeated reversals on S1 and R1 on several bars or periods.
• Lots of overall low volatility, tight price action and limited range.
• Volume declines near the pivot extremes but changes character on rejection.
• No trend coordination—all moving averages are flat, RSI is floating in the middle.
When all those start lining up, you know it is time. This is your green light to bounce trade.
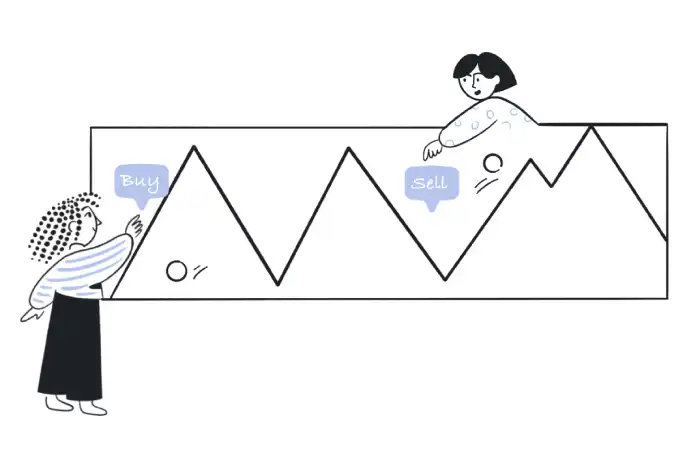
Buy Setup near Support
When the price approaches S1 and you see a bounce candle or a small wick rejection, consider going long. Put your stop just below S1. Aim for the pivot point (PP) or R1, depending on the Sell Setup as Price Hits Resistance.
When the price is hesitant as it approaches R1, look for a short. You will place your stop just above R1, and by initiating this trade, you are most likely targeting either the pivot price to the downside or S1 below. Conservative or aggressive should depend on volume or momentum (or both) in the latter part of the trade.
Playing the Middle Zone
I also like the trade reversal commonly called a "reversal" off of PP. When a price is sitting there and reversing, it is usually going to swing to S1 or R1, based on the direction. This is oftentimes when sentiment does a flip at some point in the mid-range.
The beauty of all range-based trading strategies comes from a systematic expectation of human behaviour. Traders look at the key absorption zones and act based on buying or selling at perceived "value" on support and "value" on resistance.
Pivot formulas mathematically construct the buying/selling actions of sellers/buyers. Over time, the systematic expectation of this behaviour reinforces itself and allows for classic double tops or bottoms, creating a context for what are knowledgeable battlegrounds.
Even with a great setup, you still need to apply a filter and avoid all of the above.
• Prematurely entering trades before confirmation. i.e., you need a close or some visual rejection in the cc
• Forgetting you are using pivots while the markets are trending. I.e., To be dynamic means you would back off if something breaks out while trending and refrain from trying to force a bounce based on pivots or anything else.
• Not considering volume context. I.e., if you see some bounce or drop, and the quality of the volume is low too, that makes this bounce or drop even more suspect.
• Not considering the larger context support. I.e., when you combine pivots with daily swing levels or moving averages, the responding actions of those pivots, context-challenged, are often much more decisive.
If your day starts with a previous high of $200, we are using a low of $190, and it closes at $195.
• PP = (200 + 190 + 195)/3 = 195
• S1 = (2x195) - 200 = 190
• R1 = (2x195) - 190 = 200
Now you are looking at a complete price zone: $190 to $200. If the price slips down to $190 reads a pin bar on volume, then you buy straight at $191, you will put your stop at $189, and now your target will be at the mid-level PP of $195, or you can stretch that to $200 if you execute well enough. Just think about that: now you are trading a clear-range and straightforward structure, with price action based on fact, not pure guessing.
• Confluence: When +R1/S1 also permit the daily highs and lows, those bounces become even better, definitely better.
• Volume patterns: If you see a bounce off of S1 on volume. It shows that we have a strong bid-side control over some major buyers who stepped away from S1.
• Time of day: Some instruments will bounce better some times in the morning or later in the day - learn the personality and rhythm of your market.
• Scale your aggressiveness: Different ranges will dictate entries in a scale (broader) or dictate to exercise patience (narrower).
Range markets are often a frustratingly slow grind of chasing the market until you have structure. This is where pivot tables in Excel differ from other structures. These pivot point box zones are the areas we expect the market to respect before entering the trade zone with determined discipline and a crystal-clear understanding of why you're there, and your entry is near some relatively correctly drawn and accurate support or resistance.
Your indication will refer you to what price is doing without having all of it hinge on wild emotion and gambling guesswork. When the sideways is spinning your head and feeling chaotic, this process gives you confidence in the analysis you have done and delivers some intention to the trades you make.
Pivot points give you clarity and control, allowing you to make reasoned decisions. You are well-equipped when reacting to random price swings and can make informed decisions to approach the market. You can layer pivot points onto your trading strategy to begin crafting a plan that yields better consistency, sensible target planning, and ultimately trades that are feel-good, not forced.
Keep building your knowledge with our structured learning path. Each section builds upon the previous one.
This is the first section
You're at the beginning of your journey!
This is the last section
You've completed this course!
15 min
Reading time
Beginner
Difficulty
