
Select your preferred language
Language changes will apply immediately
Select your preferred language
Language changes will apply immediately
Using Support/Resistance with Trend Lines
"Learn how to combine support and resistance with trend lines to spot stronger setups, confirm market direction, and improve your forex trading decisions."
Wikilix Team
Educational Content Team
If you have ever gone through times when the price charts left you feeling thoroughly confused, then you are not alone. Many traders have experienced similar uncertainty about where the price might reverse or continue, leading to the development of two of the most potent tools in technical analysis: support and resistance, and trend lines. Both support and resistance trend lines can provide proper signals on their own, and this article will explain how they can be used together to uncover damaged signals, provide a refreshing sense of clarity, and create a clearer trading plan.
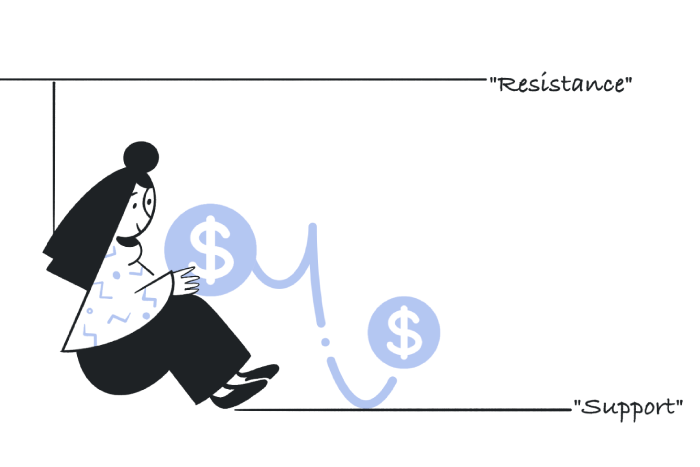
• Support is a price area where demand exceeds supply, and the price can not go lower. You can think of it like a floor where buyers step to purchase at a certain price.
• Resistance would be the opposite - the price area where supply exceeds demand, and selling is what stops this upward move. Like a ceiling, price can not break through to the upside.
• Support and resistance levels represent the psychology of traders in the market that act in a repeated way for a price level, as all traders remember it is that price level and act the same when the price comes back to that level.
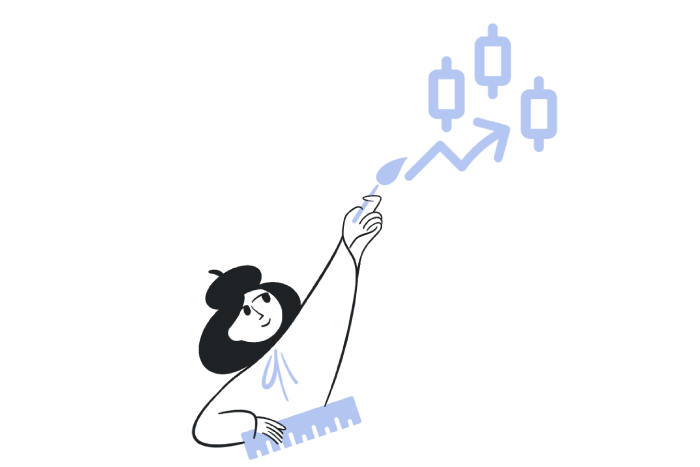
Trend lines are diagonal lines drawn on charts that connect areas of a series of successive higher lows in an uptrend or lower highs in a downtrend. Trend lines provide a visual direction for the market and a dynamic guide of where the price will continue. Trend lines differ from horizontal support and resistance lines in that they adjust in tandem with market fluctuations, offering a real-time representation of momentum.
By using these tools together, traders get the best of both worlds:
• Stronger Validation: A level where a horizontal line meets a trend line (referred to as confluence) can be more reliable than either level independently.
• Clearer Context: Support and resistance show history, while trend lines indicate current momentum.
• Better Timing: They can together improve entries and exits as new positions near these levels imply high probability areas.
1. Look for historical highs and lows that price consistently reverses itself off of.
2. Mark off round numbers or psychological levels, such as 1.2000, on most major currency pairs.
3. Look for zones as opposed to price levels - price typically overshoots a bit before reversing, so don't get hung up on the exact number.
4. Confirm the level with volume or multiple touches for added certainty.
1. In an uptrend, connect at least two significant higher lows with a straight line.
2. In a downtrend, connect two or more lower highs.
3. Extend the trendline out to where you think the price will meet the trendline again.
4. Don't force a line that doesn't fit - trend lines should complement explicit price action, not dictate it.
The real magic is when horizontal support/resistance lines up with a trend line, for example:
• Price approaches an uptrend line right at a historical support level. This confluence increases the chances that the price will bounce off this level.• In a downtrend, resistance from a prior high will occur at a trend line, making the rejection a stronger signal of conviction.
Confluence areas act as hot spots, increasing the probability of a robust reaction.
Bounce trades
When the price reaches a support, which also happens to be a rising trend line, traders will look for bullish signals (reversal candlestick) to go long.
Breakout trades
If a price breaks a trend line and also breaks through a support or resistance level at the same time, it can often result in a decisive move in the direction of the breakout.
Role reversal trades
Support becoming resistance—or resistance becoming support—is even more reliable if there is a trend line to confirm the change.
1. Too many lines: Too many trend lines or levels create clutter in your charts and confusion in your mind.
2. Not accounting for timeframes: Levels established on higher timeframes, like daily or weekly, are more important than levels determined on minute charts.
3. Collecting perfection: Price will sometimes pass through a level before turning away, and you have to think of these levels as zones.
4. Forcing trend lines: When you draw a trend line, you should only draw it when the price action creates a pattern that gives an articulated and viable trend line.
• Always check multiple timeframes. A trend line on the four-hour chart with daily support is much stronger.
• Wait for confirmation—such as candlestick patterns, volume, or indicators—to help sift through false signals.
• Keep it simple. It is better to have two or three levels that are informative than ten weak levels.
• You can practice on historical charts to see just how often prices responded to these confluence areas.
Support and resistance levels and trend lines are some of the simplest tools you will encounter in trading, but when you can use them together, you create one of the most powerful trading frameworks to make decisions. Support areas and resistance areas show you where price has reacted before, while trend lines show you where price is currently moving and whether or not the movement is strong enough to transport price. When you use support and resistance with trend lines in conjunction, you mark out confluence areas, which allow for opportunities that have a high probability of success.
Once you can master the skill of drawing and using areas and lines together, you can take the guesswork out of your trading and effectively trade with structure, clarity, and confidence. While the market will always be unpredictable, having support and resistance levels, as well as trend lines, will give you something to work with, making trading feel a lot less random.
Keep building your knowledge with our structured learning path. Each section builds upon the previous one.
This is the first section
You're at the beginning of your journey!
This is the last section
You've completed this course!
10 min
Reading time
Beginner
Difficulty
