
Beginner
Breakout or Fakeout? How to Tell Before You Enter a Trade
Breakout or Fakeout? How to Tell Before You Enter a Trade
"Don’t fall for fake moves! Learn how to spot real breakouts vs fakeouts before entering a trade. Save your capital and boost your win rate with smarter decisions."
Wikilix Team
Educational Content Team
August 3, 2025
17 min
Reading time
Beginner
Difficulty
#Entrypoint#BreakoutsvsFakeouts:WhattiWatch#forex

Have you ever entered a trade believing you've captured a breakout, only to see the price snap back and take out your stop loss in minutes? If this sounds familiar, you are not alone. Breakouts can present some of the most exciting opportunities in trading, but they can also be very misleading. The line separating a real breakout from a fakeout is fine, and knowing how to identify that line can mean the difference between consistent profits and several frustrating losses. In this article, we will help you recognize real breakouts before they happen and avoid the pitfalls of a false move that can cause frustration and cash outflow, even for experienced traders. If you have ever been faked out, you will want to read this guide.
What Is a Breakout—For Real?
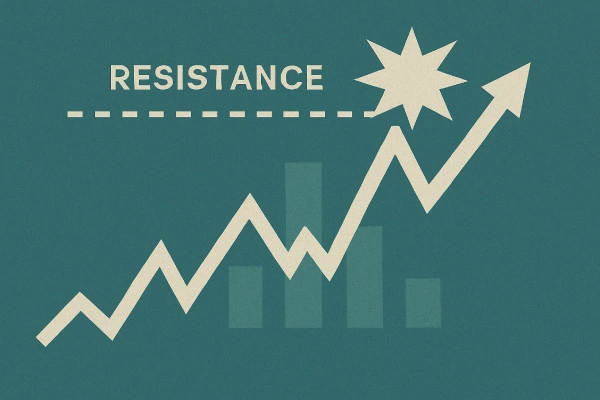
At its most basic stage, a breakout is simply a price movement beyond a defined level of support or resistance. It can be a horizontal line, trendline, or even the boundary of a chart model such as a triangle or rectangle. When price pushes and stays above (or below) a level, traders will typically take that as Confirmation that momentum is likely to continue in that direction.
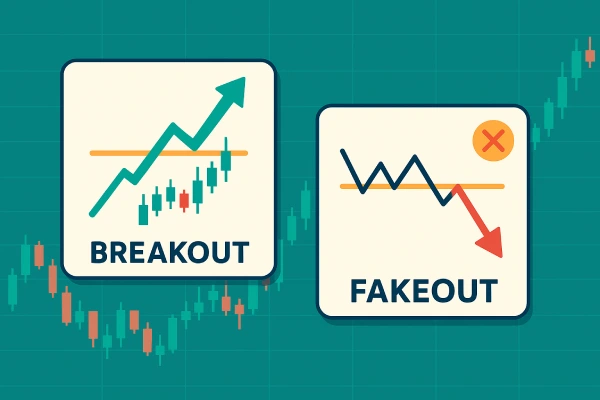
But—not all breakouts stick (this is an important "but"). Sometimes, the price will break out just enough to get traders engaged, and then the price snaps back in the opposite direction. This scenario is called a fakeout (or "false breakout"), and it can be very nasty if you are not prepared. Reasons Why Fakeouts Occur
Fakeouts occur for different reasons, but generally, they relate to market psychology and liquidity.
1. Stop-Loss Hunting
The large players (think institutions and hedge funds) generally know where retail traders put their stop-losses (just above resistance, or just below support). They trigger these stop-losses, creating short-term volatility, and then reverse the price to enter or re-enter at a better level.
2. Low Volume Breakouts
Sometimes the price breaks a level without much trading volume behind it, which can produce a "weak" breakout that lacks any conviction. Then, without volume to push it further, the price reverses.
3. News or Emotional Reactions
A breakout price move produced by a news spike or an earnings release may not be sustainable. News or emotional reactions push the price out of range briefly until logic and larger money flow price reverts.
Spotting the Difference: Breakout vs Fakeout
Now, let us get to the information you came for: how do you spot the real chance and avoid the traps?
Volume
Volume is the first and best filter for observing breaks from neo levels
Volume is one of the first filters for confirming the breakdown or breakout of a level.
• Real breakout: there is a definite spike in volume to confirm that there are more traders in the room, and the strong breakout was likely a result of institutions getting behind the move.
• Fakeout: When the break occurs on low or average volume, it shows weak conviction, and if buyers or sellers are not piling in, the price is unlikely to go far.
Pro Tip: Use a volume histogram with your chart. A strong sign of a true breakout is when the price breaks a level with volume that spikes above the previous day's average high volume.
Wait for the Retest
One of the best ways to prevent fakeouts is to wait. No need to enter right on the breakout—merely wait for a retest
What does that mean?
Price breaks above resistance
It comes back down to test that same level —and is now supported
If it holds and bounces? Well, now you have Confirmation
That Retest creates secondary conviction. If the level holds, you'll be more likely to "follow through".
2. Look at the Bigger Picture (multiple time frames)
Many fakeouts can appear convincing on shorter time frames (5m, 15m, etc.), but they often fail when viewed from a broader perspective.
Always look at a higher time frame before you enter:
A 5m breakout might be noise on a 1-hour chart
A level might look broken on one time frame, but intact on another
Golden Rule: Don't trade a breakout unless it lines up with the trend or structure on a higher time frame
3. Use Candlestick Clues
Often, candlestick patterns leave behind a trail of clues during fakeouts:
Wicks/Shadows: Long upper or lower wicks at breakout points that encourage rejection.
Engulfing Patterns: When a breakout candle is quickly followed by a strong candle going the opposite direction that engulfs the original candle—beware
Doji or indecision candles at breakout zones indicate to you that the market isn't confident.
Don't dismiss these visual clues—they often give you a heads up before things go wrong.
4. Consider the Time of Day
Some better times for breakouts:
London and New York sessions (for forex): More liquidity means a better chance of real breakouts.
Market opens and closes (for stocks): Momentum and volume are substantial.
Midday and after-hours: Often lower volume = more fakeouts.
Always make sure you know when the breakout is happening. A breakout at the wrong time will likely fail.
Breakout Entry Strategy That Works
Let's go through a precise and repeatable process to follow to enter breakouts with confidence.
Step 1: Identify a Key Level
Draw the clean, horizontal supportive and resistance lines. Avoid noise—sticking to levels that have been tested and have had multiple touches.
Step 2: Wait for Break + Retest
Once the price breaks a key level:
Don't enter immediately
Wait for the pullback and test to see if the price respects the level in question.
Look for a bullish/bearish reversal candle when the price is retracing at the level that has been broken.
Step 3: Use volume as Confirmation
When the breakout candle occurs, has the volume on your security increased significantly? If out, proceed with caution. When volume confirms, proceed with more certainty.

Step 4: Place a Logical Stop-Loss
Place stop:
Underneath the retested level (for bullish breakouts)
Above the retested level (for bearish breakouts)
Avoid placing stops right at the breakout point—that's where the fakeouts love to get you.
Step 5: Ride the momentum
Use a trailing stop or adjust your risk-reward ratio (1:2 or 1:3). Breakouts can run (if real), give your trade room to breathe.
How to avoid getting faked out
Even when using a method, you will still suffer the occasional fakeout. But how do you reduce this risk while maintaining your approach?
Stay out of choppy, sideways markets. In flat markets, breakouts rarely work.
Don't trade right before major news releases. The market gets 'jumpy'. Breakouts fail in this environment.
Use alerts and not emotion. Set alerts for key levels to confirm in the key level, not chase price.
Don't overleverage. Fakeouts are part of the game. Accept them and manage your risk appropriately.
Real World Example: Breakout done right
Let's say you are watching a stock that has been forming a tight range for 2 weeks around a resistance zone at $100.
You notice:
The stock breaks above $100 with a strong green candle
Volume (on the breakout) was double the daily average
The price then pulls back to $100 and holds
A bullish engulfing candle forms on the Retest
You enter at $101 with a stop placed at $98. Your first target is $107, with a 1:2 risk-reward ratio.
That's a picture-perfect breakout with Confirmation, structure, and volume—a high-probability setup

Last Thoughts
Breakouts can be one of the most powerful setups in trading—but only when you can tell the real ones from the fakes. Using the right tools—volume, Confirmation, patience, and multi-timeframe analysis—you can dramatically improve your win rate and avoid getting caught on the wrong side of the market.
The main point? Don't chase. Let the market show you.
Trade smart. Wait for Confirmation. And always always respect the risk.
Continue Learning
What's Next?
Keep building your knowledge with our structured learning path. Each section builds upon the previous one.
This is the first section
You're at the beginning of your journey!
This is the last section
You've completed this course!