
Beginner
Heikin Ashi: Your Underrated Tool of Smoothing Trend Analysis
Heikin Ashi: Your Underrated Tool of Smoothing Trend Analysis
" Tired of messy charts? Learn how Heikin Ashi can smooth out market trends, filter out false signals, and eliminate some of the clutter when making good trading decisions."
Wikilix Team
Educational Content Team
July 31, 2025
15 min
Reading time
Beginner
Difficulty
#Entrypoint#UsingHeikinAshiforClearerTrends#forex

Do you get the feeling sometimes that the market is just noise? One candle goes up, and the next goes down—leaving you to second guess every decision! You're not alone! Traders everywhere struggle with price charts that appear more confusing than they do helpful. But what if I told you that you could smooth out that noise with a tool that allows you to pay attention to the real deal—the trend!
Heikin Ashi is a little-known candlestick chart and your edge to identify cleaner and more accurate trends in the market. Whether you're a wannabe pro or just starting out, Heikin Ashi can cut through short price movements, helping you see the market's direction with more confidence. In this article, we will dig deeper into what Heikin Ashi candles are, how they differ from the more commonly used OHLC (open, high, low, close) candlesticks, and why they might just become your favorite tool for trend analysis.
What Is Heikin Ashi?
Heikin Ashi (Hey-kin Ah-shee) is a Japanese term meaning, “average bar”. Unlike OHLC candlesticks that only record open, high, low, and close prices for a time period Heikin Ashi uses an average of price against included formulas; results?
It's a much smoother chart that filters out the market noise and makes trends easier to see.
Here's the fundamental calculation:
• Open = (Last Open + Last Close)/2
• Close = (open + high + Low + close)/4
• High = Highest value of High, Open, or Close (this period)
• Low = Lowest value of Low, Open, or Close (this period)
Because of the averaging, Heikin Ashi candles won't have gaps, and you won't see the same choppiness that you see with regular candles.
Why Use Heikin Ashi?
Heikin Ashi isn't meant to replace your existing charting tools, it's meant to be an add-on to them. Here are some reasons as to why traders around the world use it:
✅ Cleaner Trends
Heikin Ashi makes it easier to tell if the market is trending or ranging. If the candles are long and smooth, that's a strong trend, short or mixed candles will indicate a change in direction.
✅ Less Whipsaws
One of the biggest hurdles in the traditional candlestick chart is false signals. Heikin Ashi reduces the false signals by filtering out the small movements.
✅ Visual Clarity
When you use Heikin Ashi you won't have to contemplate confusing indicator signals—there's a lot of information in the candles' shape and color, usually all you need to know.
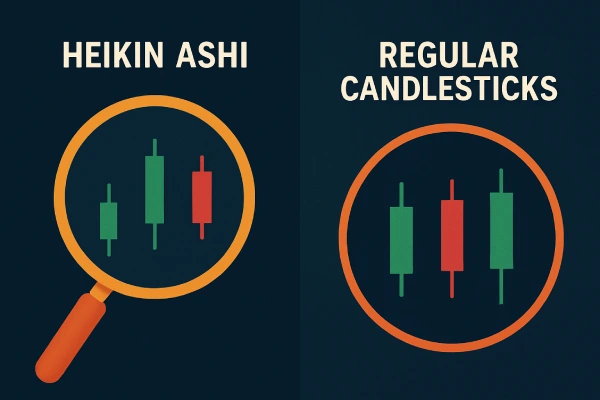
Heikin Ashi vs. Regular Candlesticks
Let’s break it down:
Feature | Traditional Candles | Heikin Ashi Candles |
Shows exact OHLC? | Yes | No (uses averaged values) |
Price gaps visible? | Yes | No |
Trend clarity | Moderate | High |
Good for scalping? | Yes | Not ideal |
Good for trend trading? | Fair | Excellent |
Heikin Ashi is not good if you need to look for specific entry points, or trade news events, but it is good for when you want to ride the trend, or hold trades longer.
How to Read Heikin Ashi Candles
There is nothing complicated about reading Heikin Ashi charts, and with a little time, and practice you will begin "seeing" the trend rather than guessing. Here are the basics:
• Strong Uptrend: Long green candles with little or no lower wick.
• Strong Downtrend: Long red candles with little or no upper wick.
• Weakening Trend / Reversal: Small-bodied candles with both upper and lower wick most likely shows some indecision, or trend shift.
Pro tip: Wait for two, or three consecutive up or down candles before entering trade on either side as a filter for possible fakeouts.
How to Use Heikin Ashi in Your Trading Strategy
Let's take a look at how Heikin Ashi fits into your actual trading strategy:
📌 1. Recognize the Trend
First, take a step back and look at a higher timeframe (1H, 4H, a continuum possibly up to a Daily). Heikin Ashi helps you swiftly identify whether the market is trending or chopping sideways. When the candles align with consistent color/direction, we are trending.
📌 2. Confirm with Other Tools
So now you’ll want to confirm with other indicators - moving average, RSI, support/resistance zones, etc. For instance, using the Heikin Ashi chart, if we see a clear uptrend and price is clearly above the 50 EMA, consider that a strong signal.
📌 3. Time Your Entry
Now you’d want to drop down to a smaller timeframe for the actual entry. You’ll also be waiting for a candle change - from red to green for example.
📌 4. Stay in the Trade
This is the best part of Heikin Ashi - If the trend is still intact and remaining smooth (the candle colors do not flip), make the trade stay in. The goal is to let your winners run. The less you are exiting and re-entering a trade the better.
📌 5. Exit on Reversal Signals
Expect to see small bodied candles or the color change (green to red, red to green). Pay close attention to these signs as they are indicators that the trend is possibly losing strength and time to secure profits.
Common Mistakes to Avoid
While Heikin Ashi can help make trend reading easier, this doesn’t mean it is perfect. Here are a few things to watch out for:
1. Relying on Heikin Ashi exclusively - Always cross reference with other tools such as trendlines or volume.
2. Using it for quick scalping trades - Due to the nature of Heikin Ashi, it will always lag slightly, meaning it is more appropriate for swing or trend trading as opposed to scalping situations.
3. Ignoring large news events - No chart will protect you from extreme volatility caused by unexpected headlines.
4. Confusing color of the candle body with direction of actual price - Remember that the Heikin Ashi candle has modified the open and the close, so do not assume that the actual market price is going to coincide with the body of the candle.
Real Example: Catching a Trend with EUR/USD
Let’s say you are researching EUR/USD on the 1 hour chart. The price has been consolidating for a small amount of time, and now the Heikin Ashi candle shows a couple of strong green candles without any lower wicks. You also check the RSI, and it is rising but not overbought, and you notice a breakout above the recent resistance.
That's your signal. You take a long position, put a stop below the recent low and take the ride. Heikin Ashi continues to print green candles for the next 7 hours. No panic. No noise. Just a clean trend. Then finally you see a small-bodied candle with a long wick on the top. That is your signal to lock in the profit and exit with a calm mind.
When Not to Trade Heikin Ashi
Heikin Ashi may be incredibly powerful, but there are times when it may not be the best option:
• Fast news events where prices matter and reactions matter
• Scalping trades that require precise timing and OHLC (open, high, low and closing price)
• Very low volume markets where the averaging effect becomes misleading
Always use Heikin Ashi as tool and not a crutch. It’s one tool in the toolbox of a well-rounded trader.
Final Thoughts:
Heikin Ashi will not make you a millionaire overnight, however, it will help you see the market clearer. And sometimes that is enough of edge.
When everyone else scrambles for every tick and candle you will be calmly taking in the bigger picture. When others don't know where the trend is going you will be surf on the wave.
In a world filled with indicators, systems, and noise, clarity is often hard to come by—and yet, it's valuable. Heikin Ashi provides this clarity: a clearer picture, a smoother experience, and a smarter process to trend trade.
So the next time you find a chart full of noise, you might give Heikin Ashi a shot. It just might be the secret weapon you were looking for.
Continue Learning
What's Next?
Keep building your knowledge with our structured learning path. Each section builds upon the previous one.
This is the first section
You're at the beginning of your journey!
This is the last section
You've completed this course!