
Beginner
Trade Divergences Like a Pro – Simple Strategy for Consistent Gains
Trade Divergences Like a Pro – Simple Strategy for Consistent Gains
": Learn how to trade divergences effectively with proven strategies. Discover how to spot hidden signals, boost accuracy, and make smarter trading decisions. Perfect for beginners and pros alike."
Wikilix Team
Educational Content Team
August 2, 2025
17 min
Reading time
Beginner
Difficulty
#Entrypoint#HowtoTradeDivergencesEffectively#forex

Have you ever felt like the market is lying to you? The price says one thing, but your gut instinct says something else. That feeling you can't quite shake off is not paranoia—it's likely a divergence. Once you can spot divergences, you will never look at a chart the same way again. Whether you are a pro trader or a beginner, understanding how to trade divergences can provide a significant advantage in your trading strategy. We will clarify exactly what divergences are, why they are essential, and most importantly, how they can help you make better, more consistent trading decisions in this article. No fluff or inflated vocabulary—we will make it simple, straightforward, and effective.
What is a Divergence?
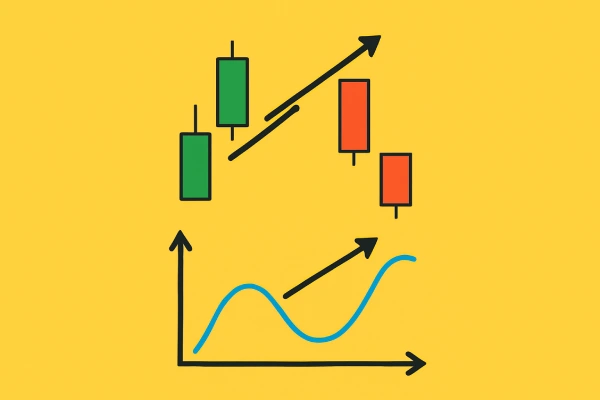
Let's keep it simple: a divergence occurs when the price movement on the chart doesn't align with the technical indicator's signal. It's the feeling of watching a person smile but seeing fear in their eyes—there is something that does not correspond. In trading, this inconsistency can signal that the trend may be losing momentum or may even be reversing.
Divergences tend to show up between price action and indicators such as the Relative Strength Index (RSI), Moving Average Convergence Divergence (MACD), or Stochastic Oscillator. If the price is pushing to new highs or new lows, and the indicator is not following that same path, you need to optimize your trade.
Types of Divergences
A Divergence can be a Regular divergence or a Hidden divergence. Each one has a different impact on traders:
1. regular Divergence – Identifying Reversals.
Regular divergence is your typical warning sign. It typically indicates a possible reversal in trend.
• Bullish Regular Divergence:
Price makes a lower low, but the indicator makes a higher low. This typically indicates sellers are losing power and could soon be overtaken by buyers.
• Bearish Regular Divergence:
Price makes a higher high, but the indicator makes a lower high. Momentum has diminished and is expected to continue declining.
2. Hidden Divergence – Identifying Continuations
Hidden divergences fly under the radar. They typically indicate continuation of the trend.
• Bullish Hidden Divergence:
Price makes a higher low, but the indicator makes a lower low. Buyers remain strong, but there is a pullback.
• Bearish Hidden Divergence:
Price makes a lower high, but the indicator makes a higher high. Sellers are still in control, even if the price has gone up temporarily.
Regular divergences work great for picking tops and bottoms. Hidden divergences allow you to trade with the trend. By knowing both regular and hidden divergences, you have a playbook.
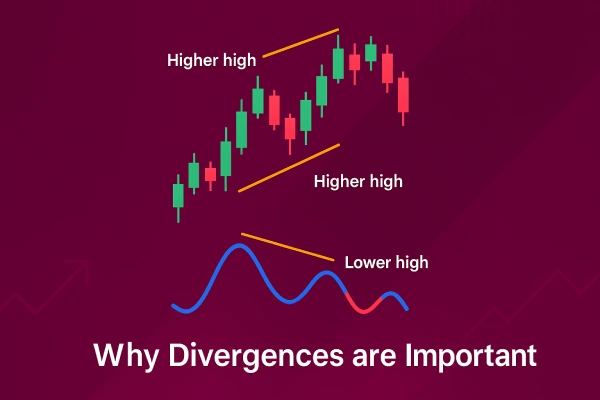
Why Divergences are Important
Divergences allow traders to look beyond the surface. Price alone doesn't tell the whole story sometimes. Indicators offer momentum, volume, or strength as a second opinion to what the market is doing. Trading Divergences can:
Minimize false signals
Help timing entries and exits
Help identify trend reversals sooner
Provide traders with more confidence in high-probability setups
Even better, divergences occur on all timeframes—whether you are scalping on 5-minute candles or holding a swing trade for several days on daily candles.
How to Trade Divergences - A Simple Step-by-Step Strategy
As you can see, trading divergences can be very simple! Let's recap the process into a clean, easily repeatable strategy to trade divergence confidently.
Step 1: Choose an Indicator
The Relative Strength Index (RSI) is one indicator that we commonly see. It is easy to read, widely available, and works well with divergence setups. You can use MACD or Stochastic Oscillator as well - the important part is consistency.
To start, set the RSI to the standard 14-period. You can always change to a different setting after you become more experienced.
Step 2: Scan for Divergence
Find price making higher highs or lower lows, and see if the RSI is making the opposite way.
Price makes higher highs → RSI makes lower highs = Bearish Divergence
Price makes lower lows → RSI makes higher lows = Bullish Divergence
You can use trendlines or horizontal levels to identify the highs or lows.
Step 3: Add Support/Resistance or Trendlines
Do not decide to trade divergence in a vacuum. Make sure to add basic support and resistance levels or trendlines to corroborate your analysis further. Divergences that were formed near a key level will be a stronger signal. For example, A bullish divergence with a key support zone is exponentially more potent than the same divergence with no context in the middle of nowhere.
Step 4: Confirmation with Price Action
After you have a divergence signal, it is imperative to have additional confirmation before you enter. Look for either a pin bar (-pattern), engulfing candle, or subsequent strong breakout candle from a consolidation zone.
This confirmation candle shows that the market agrees with your divergence—I would consider entering at this point.
Step 5: Entry, Stop-Loss & Take Profit
Entry: Right after the confirmation close.
Stop-Loss: Below the prior significant swing low (bullish) or above the swing high (bearish).
Take Profit: Either use 1:2 or 1:3 risk: reward, or could trail the stop to capture larger moves.
Simple, straightforward, effective.
Mistakes to Avoid
Even though divergences are powerful, they are not ironclad and have their pitfalls to avoid—here are a few:
• Entering too soon: Wait for confirmation—don't get ahead of a signal and take a trade for an early divergence.
• Ignoring the trend: Remember, divergences are strongest when taken with the overall trend direction. Don't battle against strong trends unless you have a solid basis for a reversal signal.
• Overloading your charts: Limit the number of indicators to one or a maximum of two. The more signals you add, the more confusion and procrastination can lead to.
• Forcing a divergence: If you have to squint your eyes, it's probably not there.
Please keep it clean. Please keep it simple.
Pro Tips for Divergence Trading
• Combine divergences with Fibonacci retracements to help with identifying potential strong reversals.
• Use multi-timeframe analysis: a divergence on a higher timeframe (like H4 or D1) is WAY more substantial than one on M15.
• Practice with historical charts before operating live so you can train your eye to see real patterns rather than random globs of wiggles.
• Add a volume perspective. If you see a divergence—and that divergence signal happens during a low-volume phase—the move is likely losing strength and fading.
Final Thoughts
Trading divergences is not some secretive code; it has been in play by professional traders for decades. What differentiates successful traders is their understanding to combine divergence signals with a clean chart structure, patience, and discipline.
You don't need to be a genius or use fancy indicators—just a disciplined eye, a repeatable process, and a straightforward approach. Master this one strategy, and it's a reliable tool wherever you go (market, timeframe, and condition).
So, the next time your chart looks sketchy—use your judgement—and knowledge—check for a divergence. It could be the missing edge you need.
Continue Learning
What's Next?
Keep building your knowledge with our structured learning path. Each section builds upon the previous one.
This is the first section
You're at the beginning of your journey!
This is the last section
You've completed this course!