
Beginner
How to Use Multi-Timeframe Analysis to Improve Your Trades
How to Use Multi-Timeframe Analysis to Improve Your Trades
"Want to see the bigger picture in your trades? Learn how multi-timeframe analysis can help you align short-term entries with long-term trends for smarter, more strategic decisions."
Wikilix Team
Educational Content Team
August 3, 2025
11 min
Reading time
Beginner
Difficulty
#Entrypoint#UsingMulti-TimeframeAnalysisinTrading#forex

Have you ever thought that you're doing everything right with your trading strategy, yet you still experience that "no, there's something off feeling"? You may be watching one singular chart or timeframe, and not seeing the full picture—or the little picture. Multi time frame analysis allows your trades to be in line with the overall market trend, and gives you the technical nuance around your entry and exit points. In this article, we are going to break this down into something you can have in your toolkit that is practical for you to use, easy to understand, and immediately implement—no fluff. No technical jargon. We are going to sharpen your trading knife one timeframe at a time.
What is Multi Time Frame Analysis?
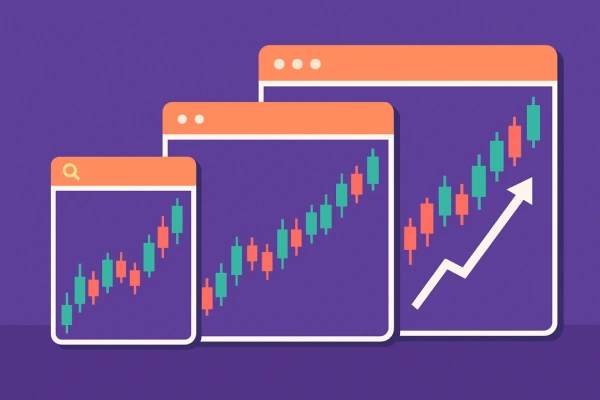
Multi Time Frame Analysis (MTFA) is looking at a financial asset on multiple timeframes prior to a trade. So instead of just looking at a 15 minute chart or a daily chart, you are looking at multiple timeframes—typically the higher timeframes and lower timeframes of the 1 hour, 4 hour, daily, and weekly charts so you have context around market conditions.
Think of it like each timeframe is telling a different story:
• The higher timeframes (weekly/daily) are telling you the direction of the market trend.
• The lower timeframes (1 hour/15 minute) are telling you the best possible entries/exits.
When they all line up, now you have a trade setup. MTFA is like using Google Maps; it has several levels of zoom; you can see the overall picture, the current conditions and the street level detail prior to deciding to drive.
Why Does Multi Time Frame Analysis Work
Markets are not driven randomly. The market moves in cycles. It operates in cycles. The market repeats itself over and over, on different timeframes. For example, a bullish breakout on the 1-hour chart may look good, until you zoom out and see there's just a bounce in a larger downtrend on the daily chart.
MTFA helps you:
• Identify false signals on smaller charts
• Trade in a direction with the trend, not against it
• Identify the levels of key support/resistance from higher timeframes
• Increase confidence in trading decisions
In short, it lets you block out the noise and put your trades into context.
Which Timeframes to Use
The most important aspect of multi-timeframe analysis is what timeframes to combine. A rough rule, is to have a time ratio of approximately 1:4 or 1:6.
Some examples:
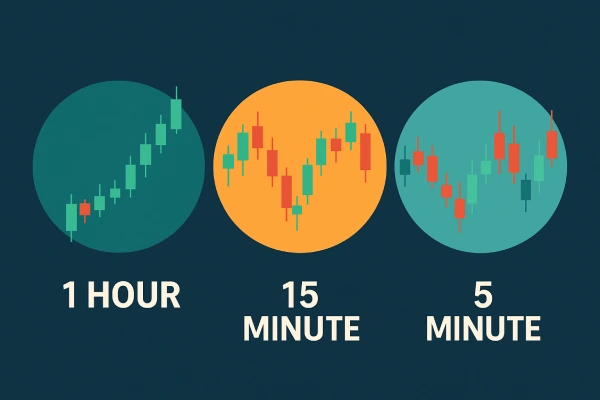
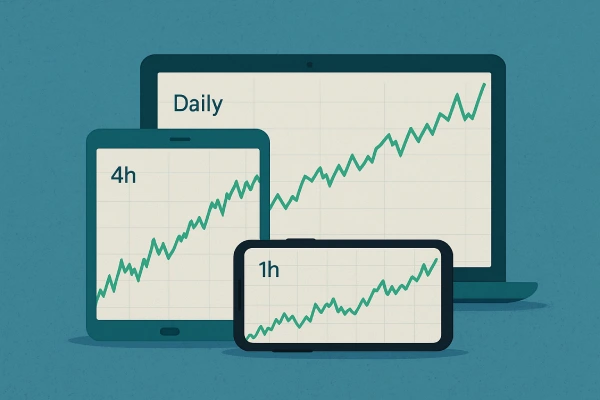
• Weekly → Daily → 4-Hour (Good for swing traders)
• Daily → 4-Hour → 1-Hour (For position or active swing traders)
• 4-Hour → 1-Hour → 15-Minute (For Day traders)
The higher timeframe helps declare the trend, the middle timeframe determines momentum or consolidation, and the lower timeframe does the precision entry and stop-loss.
Watch out for over-trading the charts - if you look at too many charts you can suffer from analysis paralysis and want to look at charts. Stick to 3 time frames max.
Applying Multi-Timeframe Analysis: Step-by-Step
Let’s simplify the process into a 4-step process.
1. Look at the Higher Timeframe first
Start off with the largest timeframe in your setup (dailyAsk:
- What is the overall trend?
- Are we at a significant support/resistance price level?
- Is momentum staring to build or fade?
This is called "the market context". You're not planning to trade based on this chart—you're just trying to assess the environment.
2. Move to the Middle Time Frame
Next, go down one level (ie: 4 hr or 1 hr). At this stage, you're looking for:
- Confirmation of the directional trend (ie: higher highs/higher lows in an uptrend)
- Evidence of consolidating or breakout trade setups
- Candlestick or technical patterns that correlates to the higher time frame moves
If the middle time frame is in contradiction to the higher time frame—this is a warning sign. Think about holding off.
3. Zoom into the Lower Time Frame
Lastly, you're onto the lowest time frame. At this stage, you're looking to:
- Identify your entry point
- Mark your stop-loss and take profit zones
- Add timing precision to your execution
Ideally, all three time frames will provide support for your trade idea. Traders call this "alignment" and it carries great weight.
4. Execute and Manage
Once you have this alignment - execute the trade. Don't just walk away, continue to monitor all three time frames - especially the higher - for potential trend changes.
Things to Avoid
Using multi-timeframe analysis can be powerful but can easily fall to misuse. Here are some traps:
- Jumping between arbitrary time frames
Don't jump between 1 minute and daily time frames.vertizing through multiple time frames to ask yourself questions in the "market context". Use a structured trinity of timeframes that connect in your logic.
• Looking for bias confirmation.
Don’t force smaller timeframes to validate your bias. Be careful to remain objective. If it is not, then do not trade.
• Cluttered with indicators.
Keep it neat and tidy. You don’t need 10 indicators on every chart. It’s about price, key levels, and 1-2 indicators of support (i.e. RSI or moving averages).
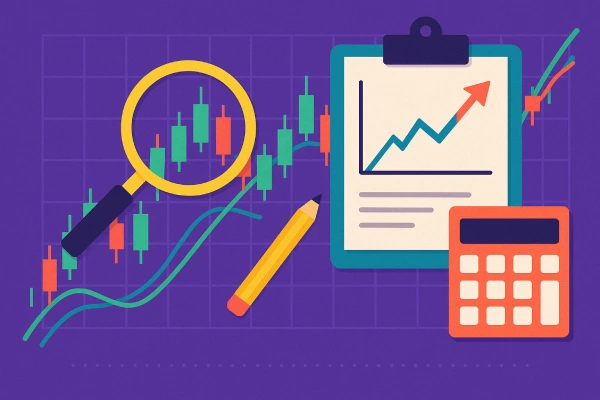
Tools that Are Useful in MTFA
Most trading platforms like TradingView, MetaTrader, and Thinkorswim provide a way to open up multiple chart windows. A few tools that help you save time and seamlessly operate include:
• Layouts: Take advantage of tiled windows for a side-by-side comparison of different timeframes.
• Link timeframes: Link charts, and switch symbols to ensure that all timeframes update.
• Place alerts: Set alerts to notify you on higher timeframes when price reaches key levels, even if your primary focus is a lower timeframe.
Utilizing all of these features can streamline MTFA into a more natural and quicker experience—especially when you are live trading.
Example of Real Time Analysis on a EUR/USD Trade
Imagine you are analyzing EUR/USD:
• Daily Chart: price has a clear uptrend, nearing a key resistance zone.
• 4-Hour Chart: bullish flag pattern forming just beneath resistance—looks like momentum is building.
• 15-Minute Chart: breakout above flag, strong volume, clean break.
You take a long entry at the breakout of the 15-minute timeframe, setting a stop below the flag and aiming for the next major resistance area from the daily chart.
So, you are not chasing a random move; you are trading with the trend, structure, and timing all aligned.
In Conclusion
Multi-timeframe analysis isn’t going to be your magic-toggle switch of unanticipated results, but it will provide you serious advantages in being able to see trades more clearly, avoid the many traps out there, and gain some confidence. It slows you down just enough to think strategically, while still being able to act tactically.
Whether you are a day trader, swing trader, or anything between, MTFA connects your timeframes and puts context, clarity, and confidence behind your decisions.
Continue Learning
What's Next?
Keep building your knowledge with our structured learning path. Each section builds upon the previous one.
This is the first section
You're at the beginning of your journey!
This is the last section
You've completed this course!