
Beginner
Elliott Wave Theory Made Simple
Elliott Wave Theory Made Simple
"Confused by Elliott Wave Theory? This simple guide breaks it down so you can spot market cycles, predict price moves, and trade with greater confidence."
Wikilix Team
Educational Content Team
July 31, 2025
15 min
Reading time
Beginner
Difficulty
#Entrypoint#ElliottWaveTheoryMadeSimple#forex

Have you ever looked at a price chart, and it appeared to be speaking the language of a select elite few traders? In other words, this swirling mess of candles, trends, spikes, and crashes can appear complicated as hell. But, what if you could structure your way through those patterns and see where the market may intend to go next? That is what Elliott Wave Theory will facilitate for you, and we will structure it in a way that makes sense in this article - no jargon, no oversocialization - just a human way to understand one of the powerful forecasting tools in technical analysis.
what is Elliott Wave Theory?
Elliott Wave Theory is a method of technical analysis that enables a trader to interpret market cycles and predict at what price they may advance next. Ralph Nelson Elliott conceived Elliott Wave Theory in the 1930s based on the theory that markets move in repetitive waves as a result of investor psychology.
Waves will fall generally into the following two categories:
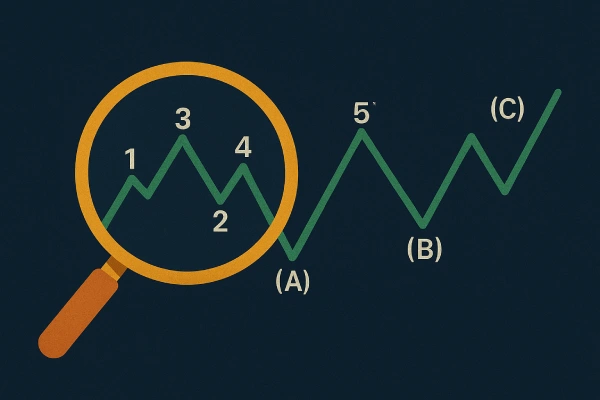
As shown in the chart, a trending market consists of five waves in the order of trending waves (impulse) and three waves against the trend (correction). This 5-3 structure of waves continuously repeats itself across multiple cycles and timeframes from minutes to months. Elliott recognized that crowd psychology is an ebb and flow from optimism to pessimism, and vice versa, creating these repetitive patterns. By identifying this cyclical rhythm, a trader can anticipate price movements more effectively.
Why Elliott Wave Theory is Important
If you can recognize these waves, you can be ahead of the curve. Rather than reacting to price swings with emotion, you will be able to develop an ability to see structure amongst the chaos. It helps you:
· Identify where the likely entry or exit points might be
· Identify market sentiment
· Identify likely continuations or reversals
· Identify where you currently are in terms of more macro cycles
And perhaps most importantly, it keeps you disciplined and focused on the trend rather than the noise of price swings.
Elliott Wave Theory can be less useful when used in conjunction with other analysis types. It contextualizes price movements, allowing you to adjust your game plan using a probability framework.
The truth is, most people make Elliott Wave Theory overly complicated. They use dozens of wave counts, are concerned about the various labels, and in the end, they have a chart that looks like abstract art. If you struggle to study this online, you may have given up.
You do not have to do that to get started.
Let’s make it easy:
Program your brain to recognize the five-wave impulse (and three-wave correction).
First, identify these patterns on higher timeframes (daily or 4-hour).
Don’t become overzealous with micro-counts; focus on significant swings.
Keep your charts simple and straightforward.
When you identify these basic wave structures, the rest of the theory will be smooth sailing!
Once you get comfortable identifying these primary wave structures, everything else in the theory gets much easier.
The Anatomy of a Wave: Impulse and Corrective
Let's take a closer look at what waves look like, and how they play out in real-life market conditions:
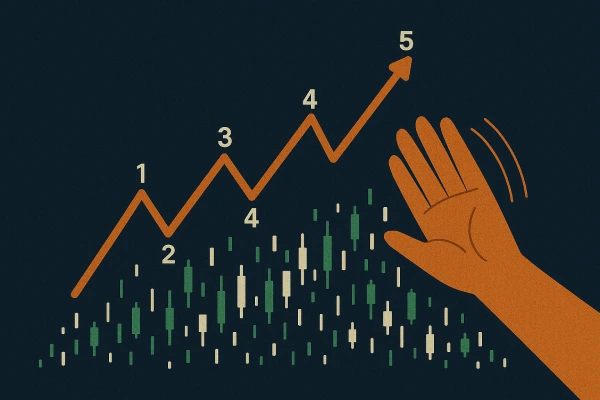
Impulse Waves (1, 2, 3, 4, 5)
· Wave 1: The start of a trend. Generally subtle. Recognized by only a few early movers.
· Wave 2: A pullback that retraces part or all of Wave 1. Sentiment is still mixed.
· Wave 3: Usually the longest wave and strongest. Momentum is building. More traders join in.
· Wave 4: A pause or going sideways. Traders are taking profits.
· Wave 5: The last move of the trend. Often associated with optimism or euphoria.
Corrective Waves (A, B, C)
· Wave A: The first move against the trend. Traders are uncertain whether this represents the trend's retracement.
· Wave B: A partial retracement that appears to be a continuation of the trend.
· Wave C: The more definitive move, which indicates a correction. Typically equal to Wave A in length.
These patterns appear in all markets and all timeframes. The magic is learning to recognize them appropriately. identified the waves - price action will be changed for you forever.
Ways To Easily Spot Waves
1. Clear charts - Don't add too much clutter. Too many indicators or anything to distract you from the price structure.
2. Begin with the trend - Is the market trending? Or is it moving sideways? It is easier to spot waves in a trending market.
3. Zoom out - Start with the higher timeframes. To get a proper view of the significant wave structures in the market.
4. Mark swing highs and lows - Waves are very structured movements between those swing highs and lows.
5. Be flexible - We have to remember that Elliott wave is part science and part art. There is no one "right" wave count.
6. Use reference examples - Look at past charts, and start by practicing labeling waves on previous price action.

Tools for Your Consideration
While Elliott Wave Theory can undoubtedly be done with only price action data, you have some tools below that you can use to assist in confirming your analysis:
1. Fibonacci retracement: Generally, in typical wave corrections, price tends to conform to key Fibonacci retracement levels (38.2%, 50%, 61.8%, etc).
2. Trendlines & channels. Consider drawing trend support/resistance or channel lines close to the waves, to visually see the structure and boundaries of the waves.
3. Volume analysis: Wave 3 typically tends to exhibit a surge in order volume. In corrections, the volume typically tends to decrease.
4. RSI & MACD. It can indicate divergence and could be helpful with potential turning points of the wave.
Ultimately, consider using the suggested tools to confirm your wave patterns and enhance your confidence in your analysis.
Common Mistakes
There are pitfalls even advanced traders can fall victim to using Elliott Wave Theory.
Make sure to avoid the following pitfalls:
1. Over labelling: Just because something occurred on the chart, doesn't mean you need to label it a wave; KISS - Keep it simple!
2. Confirmation bias: Don't try to jam a wave into a pre-conceived wave count, or in some instances, you may be forcing the chart into a wave very comfortably.
3. Ignoring the bigger picture: Always remember to consider the larger trend before you drop down in size and start to narrow down into smaller waves.
4. Ignoring your risk management: Keep in mind, Elliott Wave is not the be-all and end-all. Keep stop losses in place.
5. Chasing perfect: Understand that no count will be 100% perfect; focus on probabilities.

A Real Life Example
Let's imagine that a technology stock has been in an uptrend for several months, and you see on the daily chart:
· A clear five-length wave upward movement with increasing momentum
· Followed by a three-length wave downward correction in the form of an ABC
Based on seeing this, you believe that the correction is about to be complete. Wherever your choice is from volume spikes, bullish candlestick patterns, or Fibonacci support, there may be confirmation. After price action gives you confirmation of your idea, you pull the trigger on the trade heading into the next impulse wave.
Now you are not just guessing – you are trading with structure and intention.
The Beauty of Patience
You will not master Elliott Wave Theory in one day. You are not here to predict all market movements. It is an ability developed by experience, practice, and apparent random trial and error. Each time you study the market with patience and discipline, Elliott Wave Theory will become a more valuable piece of your trading procedure and a lifelong skill.
So take your time. Begin with major wave formations, focusing on structure rather than chasing every tick. Taken together with the experience of studying multiple charts, identifying will be second nature.
Closing Thoughts
Elliott Wave Theory does not claim to predict the market at every level with pinpoint accuracy. Instead, Elliott wave theory provides a path to identify structure and work with probabilities. We can take a new approach, create a simplified outlook based on just understanding impulse and corrective waves.
So next time you look at a chart, take a deep breath. Zoom out. Look for a pattern and, more importantly, feel the rhythm! Once you have identified the waves, your price action will be forever changed.
Continue Learning
What's Next?
Keep building your knowledge with our structured learning path. Each section builds upon the previous one.
This is the first section
You're at the beginning of your journey!
This is the last section
You've completed this course!