
Sélectionnez votre langue préférée
Les changements de langue seront appliqués immédiatement
Sélectionnez votre langue préférée
Les changements de langue seront appliqués immédiatement
RSI Indicator Explained: Complete Guide & Trading Strategies
"Learn what RSI is, how it works, and how to use this widely-known indicator to assess market strength, identify trends, and find trading opportunities."
Équipe Wikilix
Équipe de Contenu Éducatif
Have you ever seen a stock (or your favourite crypto pair) going up and down, and wondered, "Is this momentum real, or is it noise?" That's where RSI comes in, like a friend telling you the stock chatter. It's more than just telling you how fast prices are changing—it tells you if they're rushing toward burnout or preparing for the next push. Stay with me and you'll understand how RSI can be your hush-hush radar in the market circus.
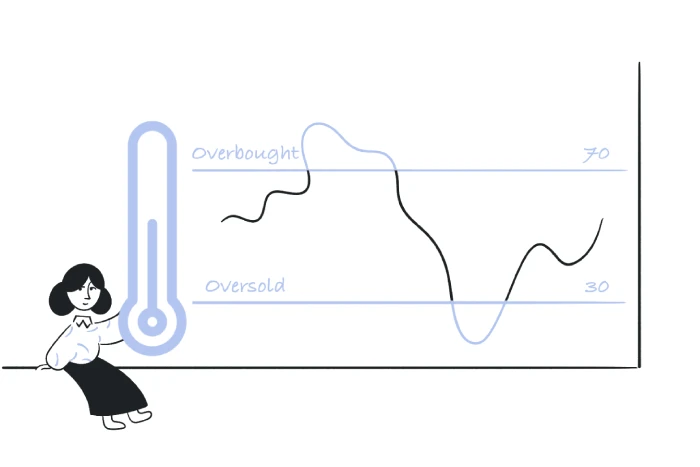
RSI stands for Relative Strength Index, a technical tool that traders use to assess how strong (or tired) a price move is. Think of it as a momentum meter that goes from 0 to 100. If you see numbers over 70, it's signaling an asset may be overbought and possibly ready for a break or pullback, while under 30 suggests the asset may be oversold and due for a relief bounce. Concise, and stylin', along with powerfully informative!

This is how it works:
• First, you find the average gains and average losses over a selected period of time (usually 14).
• Then, you create the relative strength (RS) by dividing the average gain by the average loss. It is just a ratio.
• Lastly, substitute RS into a formula that gives you a scale between 0 and 100.
Depending on the numbers, what do you think? A solitary line on your chart will fluctuate to either signal vigor (strengthening momentum) or passivity (weakening momentum). This is RSI in a nutshell.
A. Overbought and Oversold Areas
Is RSI above 70? The market is likely overbought and set for a reversal or a breather. Is RSI below 30? A buying opportunity may be approaching. They are proper signals, but do not consider them certainties.
B. RSI Divergences
Here is the REAL gold:
• Bearish Divergence: Price pushes to a new high, RSI does not. This indicates weakness is approaching.
• Bullish Divergence: Price had a new low, RSI is still high. This may suggest upward momentum is coming.
C. Midline Crosses
The midline (50) is also a good indicator:
• RSI crosses elevated 50 → Bullish momentum.
• RSI crosses beneath 50 → Bearish momentum.
Typically, one period is set to 14 as it is a good balance between direction and stability. But it is only one option!
• Shorten the period (example 9), so it gives quicker and more frequent signals, but also more noise.
• Lengthen the period (example 21), so it is moving smoothly, but slower to indicate.
This also depends on the trading timeframe. Either short-term scalping or longer-term trading will require adjustments to fit RSI to the trading background.
A. Overbought/Oversold Counter-Trend Moves
When the RSI dips below 30, then moves back above it, that bounce is an indication of a potential short-term rally. On the other hand, once the RSI moves above 70 and begins to move lower, it is a strong sign of a possible pullback.
B. Trading Divergences
If you notice a discrepancy between the price and the RSI, pay attention to this signal, as it may indicate the beginning of a directional change. Combine that with a price movement or support/resistance zones, and you can make your entries even better.
C. Trend Confirmation Using 50-Level
If the RSI stays above the 50-level during any pullbacks, that is a sign of strength in the uptrend. If the price falls below the 50-level consistently or after a pullback, it could indicate further selling.
The RSI indicator is most potent when combined with indicators that provide supporting evidence:
• Moving averages to confirm the trend direction.
• Volume to measure the commitment behind price movements.
• Price patterns like channels or trendlines - RSI divergences in these areas tend to be more reliable.
Strengths:
• Easy to read, clear, and defined levels to follow.
• Matches momentum and potential reversals in one single indicator.
• Any asset type - stocks, crypto, forex, commodities.
Weaknesses:
• False signals can occur in erratic, choppy, non-trending markets.
• Overbought does not indicate an imminent top; sometimes, momentum carries price higher.
• RSI works best when paired with some confirmation, as a standalone indicator, it is typically not a reliable signal.
What is the truly unique value proposition of RSI? It visually identifies price strength compactly and transparently. It is different than indicators which only measure volatility or trends. It combines aspects of both volatility and trend while simultaneously identifying momentum and potential reversals or changes of course using the same 0 – 100 scale. The proprietary zones with divergence help make it suitable for traders of all levels.
Let RSI be your guide; it alerts you to when the market is heating up, cooling off, or potentially changing courses.
• Above 70 → Be alert for exhaustion occurrence or pullback
• Below 30 → A bottom could potentially be nearby
• Divergences → hidden strength or weakness
• Cross 50 → momentum shoes signs of changing direction
Combine RSI with price context or action, confirm with other indicators or tools, and practice your craft across timeframes. With time and practice, RSI will become more than a number; it will be your silent guide, amid all the market noise.
Continuez à développer vos connaissances avec notre parcours d'apprentissage structuré. Chaque section s'appuie sur la précédente.
C'est la première section
Vous êtes au début de votre parcours!
C'est la dernière section
Vous avez terminé ce cours!
13 min
Temps de lecture
Débutant
Difficulté
