
Forex volatility is the magnitude and frequency of a currency pair's price movement over a given period. It says nothing about direction: a pair that moves 150 pips up and one that moves 150 pips down are equally volatile, and a pair grinding 20 pips sideways is not volatile at all.
That distinction is the practical point. Volatility is an input to risk arithmetic — how wide the stop, how large the position, whether the trade is worth taking at the current spread — not a reason to buy or sell.
What Is Forex Volatility?
Formally, volatility is the dispersion of returns. A trader deals with two versions:
- Realised (historical) volatility — how much the pair has actually moved, measured from past prices. ATR, standard deviation and average daily range all describe this.
- Implied volatility — what the options market expects, extracted from FX option prices. It rises ahead of scheduled risk events and falls once they pass.
Both are expressed as a size, never a sign. An annualised implied volatility of 8% on EUR/USD describes the width of the expected range, not the direction of the euro.
Volatility is also not trend. A pair can be highly volatile and directionless — large ranges that close near the open — or trend steadily on modest ranges. Reading a volatility number as a directional signal is the most common beginner error here.
What Causes Volatility in the Forex Market?
Prices move when the market's view of relative monetary policy, growth or risk changes.
- Interest-rate decisions. Rate differentials are the main long-run driver of currency valuation, so scheduled decisions from the Federal Reserve, ECB, Bank of England, Bank of Japan and Swiss National Bank produce the largest single-minute ranges of the month in the pairs they touch.
- Central-bank communication. The statement and the guidance often matter more than the decision, because the decision is usually priced in and the guidance is not. The Bank of Japan's December 2022 move is the standard example: as the BIS recorded, it "unexpectedly widened the floating band of the 10-year yield" — a change of stance rather than a rate move.
- Economic data. US non-farm payrolls, CPI and PMI releases move pairs in proportion to how far the number lands from consensus. The timing is known, so the volatility is anticipated rather than surprising.
- Geopolitics and risk sentiment. Conflict, elections, sanctions and banking stress push flows into the dollar, yen and Swiss franc.
- Liquidity conditions. The same order does more damage at 22:00 GMT than at 13:00 GMT, and far more in USD/TRY than EUR/USD. Month-end, holidays and the hours around the Asian open all thin out. Turnover also shifts over time: the BIS 2025 survey recorded USD/CNY, USD/CHF and USD/HKD turnover rising 59%, 60% and 95% respectively against April 2022.
Why Does Forex Volatility Matter to Traders?
Volatility sets the size of the prize and the size of the bill at once.
Profit potential. A strategy needing 60 pips of follow-through cannot work on a pair whose average daily range is 45 pips.
Stop placement. A stop must sit outside normal noise but inside your risk budget. When noise doubles, last month's stop is inside the noise band and gets taken out by movement that means nothing.
Execution costs. Spreads widen with volatility and with thin liquidity, and the two often arrive together. A pair quoted at 0.6 pips in the London–New York overlap can be several pips wide a second after a rate decision.
Slippage. In fast markets a stop becomes a market order at whatever price exists. Planned risk and realised risk diverge, always in the same direction.
Position sizing. Keep lot size constant while volatility doubles and you have doubled risk per trade without deciding to.
How to Measure Forex Volatility
Measuring comes before trading. These measures describe the same thing from different angles; none forecasts direction.
ATR (Average True Range)
ATR was developed by J. Welles Wilder in his 1978 New Concepts in Technical Trading Systems. A plain high-minus-low range misses volatility that arrives as a gap, so true range is the greatest of three values: current high minus current low; the absolute value of current high minus previous close; and the absolute value of current low minus previous close. ATR is a smoothed average of that, conventionally over 14 periods.
It is used three ways: stops set as a multiple of it (1.5× or 2× beyond entry is conventional), targets expressed in the same units, and position size scaled inversely so account-currency risk stays constant. Two limits matter. ATR is absolute, not relative, so comparing instruments at different price levels means using ATR as a percentage of price; and its value depends on the lookback, so a 14-period ATR on a 5-minute chart and on a daily chart answer different questions.
Historical Volatility
The standard deviation of returns over a lookback window, usually annualised. Its value is as a regime reading: 20-day realised volatility against the 100-day figure tells you whether the market is unusually active or quiet by its own standards. A 20-day reading well below the longer average is compression — breakout systems tend to work and mean-reversion systems starve. The reverse regime punishes tight stops.
Average Daily Range (ADR)
The crudest measure and often the most useful intraday. Average the daily high-minus-low over the last 10 or 20 sessions for a plain expectation of how far the pair travels in a day. If a pair has already covered most of its ADR by mid-session, a continuation trade is paying full price for the tail of a move; if today's range is a third of ADR by the London close, an intraday target has to be scaled to that.
Implied Volatility
Implied volatility from FX options is the market's forward expectation, used mainly as an event calendar with numbers attached: a jump in one-week implied volatility says the options market is pricing a specific upcoming risk, whether or not you know which one.
Best Forex Volatility Indicators
| Indicator | What it tells you | Best used for |
|---|---|---|
| ATR (14) | Absolute average movement per bar, gaps included | Stop distance, target sizing, position sizing |
| Bollinger Bands (20, 2) | Where price sits relative to recent dispersion | Spotting compression and expansion regimes |
| Standard deviation | Statistical dispersion of returns, unsmoothed | Regime comparison, quantitative filters |
| Keltner Channels | ATR-based envelope around an EMA | Trend-following entries, smoother than Bollinger |
Bollinger Bands were created by John Bollinger: a 20-period simple moving average with bands two standard deviations either side. Because they are built from standard deviation they widen as volatility rises and contract as it falls, which makes them a visual volatility gauge rather than only an overbought/oversold tool. The narrow-band Bollinger Band Squeeze — best read off the companion BandWidth indicator rather than by eye — marks compression that frequently precedes expansion. Bollinger's own guidance is that the bands should contain roughly 88–89% of price action, which is what makes a close outside them meaningful.
Keltner Channels build the envelope from ATR rather than standard deviation, so they react less violently to a single outsized bar: steadier for trend-following rules, while Bollinger is sharper for detecting regime change.
There is no single best indicator. ATR is the best measurement tool because its output is in pips you can put into a position-size formula; Bollinger Bands are the best contextual tool because they show compression and expansion at a glance.
Which Forex Pairs Are the Most Volatile?
Volatility is broadly the inverse of liquidity, and forex liquidity is concentrated. The BIS Triennial Central Bank Survey put global OTC FX turnover at $9.6 trillion per day in April 2025, up 28% from $7.5 trillion in 2022, with the US dollar on one side of 89.2% of all trades.
- Majors (EUR/USD, USD/JPY, GBP/USD, USD/CHF, AUD/USD, USD/CAD) — deepest books, tightest spreads, lowest volatility in percentage terms. EUR/USD is the quietest; GBP/USD and USD/JPY are consistently more active.
- Minors / crosses (EUR/GBP, GBP/JPY, EUR/JPY, AUD/JPY) — no dollar leg, so they inherit the volatility of two pairs at once. GBP/JPY is the classic example.
- Exotics (USD/TRY, USD/ZAR, USD/MXN) — thin books, wide spreads, exposure to domestic politics, capital controls and intervention. Ranges can be enormous, but trading cost and gap risk rise faster than the opportunity does.
The practical filter is not "which pair moves most" but "which pair moves enough relative to its spread". An exotic with a 400-pip daily range and a 40-pip spread is a worse instrument than a major with a 90-pip range and a 1-pip spread. Comparing ATR as a percentage of price against typical spread — figures your broker publishes, and worth checking against independent listings such as those on Wikilix — settles it quickly.
When Is Forex Most Volatile?
The market trades 24 hours on weekdays, but the activity is not evenly spread.
The London session (roughly 08:00–17:00 GMT) is the single most active window; the New York session (13:00–22:00 GMT) is second. The 13:00–17:00 GMT overlap, when both are open, carries the deepest liquidity and the largest ranges of the day, and it is also when most US economic data lands. The Asian session is generally quieter for European pairs, with the exception of yen and Aussie pairs around Tokyo and Sydney data.
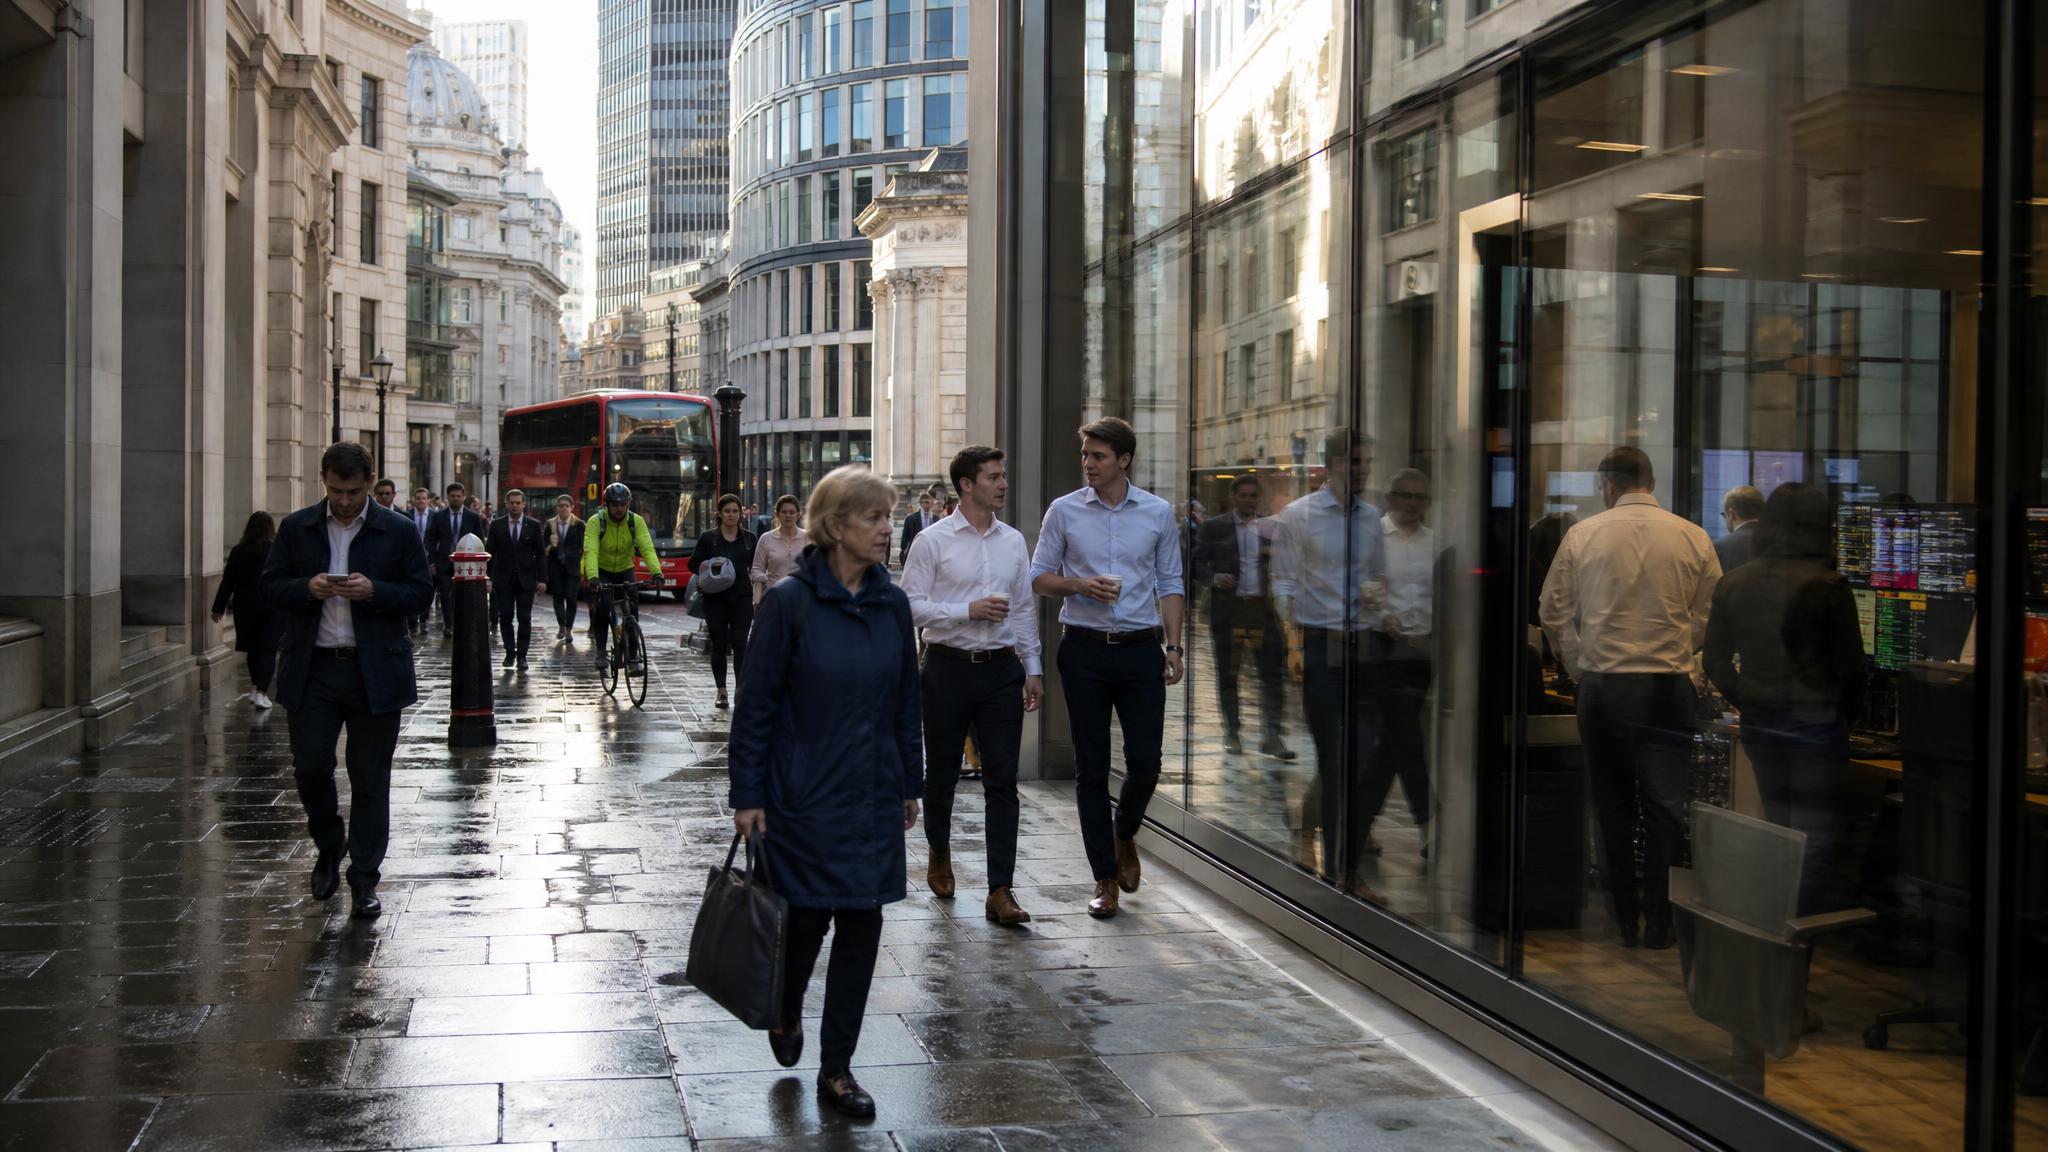
On top of that daily rhythm sit the scheduled events, and two structural points are easy to miss. Liquidity thins sharply around the daily rollover near 22:00 GMT, so spreads widen there even without news. And the Friday close to Sunday open gap is a genuine risk for any position held over the weekend, because news arrives while the market cannot price it.
How to Trade Forex Volatility
Executing a single trade, in order:
- Select the market. Screen for pairs whose ATR-to-spread ratio makes your strategy's target reachable.
- Measure before deciding. Record ATR and ADR and compare current 20-day realised volatility to its longer average. You now know the regime.
- Time the entry. Trade the session your pair belongs to, and know what is on the calendar for the next two hours.
- Place the stop from the measurement, not from habit. A multiple of ATR, or beyond a structural level, whichever is further.
- Set the target in the same units. If ADR will not carry price to your target, the target is wrong.
- Size the position last. Risk in account currency divided by stop distance in pips gives lot size.
Volatility Breakout Strategy
Breakout trading exploits the transition from compression to expansion. Identify a consolidation — narrowing BandWidth, a contracting ATR, a defined range — then trade the move out of it. Two disciplines make the difference: require a close beyond the range on your trading timeframe rather than trading the first touch, and place the stop back inside the range so a false break exits you cheaply. Because compression means today's ATR understates tomorrow's, size for the volatility you expect after the break.
Volatility Pullback Strategy
After a sharp expansion, immediate continuation is the most expensive entry available: the spread is wide, the move is extended and the stop needed is large. The pullback approach waits for a retracement — to a moving average, a prior structural level or a Fibonacci retracement of the impulse — and enters with a stop beyond the retracement extreme. Reward-to-risk is better because the stop is closer; the trade-off is that some moves never retrace. That trade-off is the strategy, not a flaw in it.
Trading Volatility Around News
Scheduled releases produce the largest ranges and the worst execution conditions simultaneously. In the seconds around a major print, spreads can widen by an order of magnitude, stop orders fill at whatever price exists rather than the price requested, and the first move frequently reverses once the detail of the release is read. Some brokers also raise margin requirements ahead of known events.
Three defensible responses: stand aside and re-enter once spreads normalise; cut size so that slippage on a wide stop still costs an acceptable amount; or wait for the initial spike and reversal to resolve, then trade the direction that holds. Pending orders on both sides of price minutes before a release look most attractive and work least often, because slippage on the fill and the whipsaw through both levels are exactly what news volatility produces.
How to Set Stop Loss and Take Profit in Volatile Markets
A fixed 20-pip stop is a bet that market noise is constant. The same 20 pips that sat safely outside the noise band in a quiet week sits inside it after volatility doubles, so the strategy's loss rate rises for reasons that have nothing to do with its edge.
Two adaptive methods, best used together:
- ATR-based. Stop at entry ± (multiple × ATR). The multiple is a strategy choice — tighter for mean reversion, wider for trend following — but because ATR moves with the market, the stop's distance from noise stays roughly constant.
- Structure-based. Stop beyond the swing high or low, the range boundary, or the level that invalidates the trade idea. Then check the resulting distance against ATR: if it is far inside one ATR, the level is too close to survive normal movement.
For targets the same logic applies in reverse. Express the target in ATR or ADR units and check it is reachable within your holding period.
How Does Volatility Affect Position Size?
Directly and inversely, if account risk is held constant. The arithmetic is fixed:
Position size = (account equity × risk per trade %) ÷ (stop distance in pips × pip value)
Only one term on the right changes with volatility, and it is in the denominator. If your stop has to double from 30 pips to 60 pips because ATR doubled, position size must halve to keep the monetary risk identical. A trader risking 1% of a $10,000 account with a 30-pip stop on a standard pair is trading roughly 0.33 lots; the same 1% with a 60-pip stop is roughly 0.17 lots.
The failure mode is holding lot size constant and letting the stop widen, which converts a 1% risk into a 2% risk without any decision being made. Volatility-adjusted sizing is what makes a strategy's results comparable across regimes.
Forex Volatility vs Liquidity: What's the Difference?
Volatility measures how far and how fast price moves. Liquidity measures how easily a given order can be executed near the quoted price — depth on both sides of the book, tight spreads, small market impact.
The relationship is usually inverse, since a thin book amplifies the price effect of any order, but the two can diverge. EUR/USD during the London–New York overlap on a payrolls day is simultaneously extremely liquid and extremely volatile; USD/TRY at 03:00 GMT is illiquid and may be temporarily quiet. Liquidity determines your cost — spread, slippage, whether a large stop fills at all — while volatility determines your opportunity and your required stop distance. A tradable instrument needs enough volatility to reach a target and enough liquidity to make the round trip affordable.
How to Manage Risk When Forex Volatility Is High
- Cut position size first. It is the only lever that reduces every other risk at once.
- Reduce leverage. Regulators treat leverage as a volatility control directly. ESMA agreed measures on 23 March 2018 capping retail CFD leverage at 30:1 on major currency pairs, 20:1 on non-major pairs, gold and major indices, 10:1 on other commodities and non-major equity indices, 5:1 on individual equities and 2:1 on cryptocurrencies — tiered explicitly by the volatility of the underlying. Those measures were temporary by design, renewable only three months at a time under MiFIR, and ESMA stopped renewing them on 31 July 2019 because "most national competent authorities (NCAs) have taken permanent national product intervention measures relating to contracts for differences that are at least as stringent as ESMA's measures". The caps you actually trade under today are therefore national ones that mirror the ESMA original without being identical to it. In the UK, the FCA's permanent rules have applied since 1 August 2019 and limit retail CFD leverage to between 30:1 and 2:1.
- Budget for wider spreads. Recalculate whether the strategy is still profitable at the spread you will actually pay, not the average one advertised.
- Assume slippage on stops. Plan the loss at a worse price than the stop level.
- Know the calendar. Every position should have a known answer to "what is scheduled before I exit?"
- Check the protections you actually have. The FCA's permanent rules also require firms to close out a position when funds fall to 50% of the margin needed to maintain it, and to guarantee that "a client cannot lose more than the total funds in their CFD account". Comparable national measures apply across the EU, but these are jurisdictional rather than universal — verify what your own broker's regulation provides before you rely on it.
- Avoid overtrading. Large ranges make every chart look like an opportunity. The number of trades taken per day should not be a function of how exciting the market looks.
Is High Forex Volatility Good for Trading?
In favour: larger ranges mean profit targets are reachable in less time, trends develop faster, breakout and momentum strategies get the expansion they need, and there are more setups per session.
Against: uncertainty rises with the range, so the same setup has a wider distribution of outcomes. Execution deteriorates through wider spreads and slippage. Stops must widen. False signals multiply, because indicators calibrated on quiet conditions fire more often. And drawdowns arrive faster, which is a psychological cost as much as a financial one.
The resolution is that volatility is neither good nor bad — it is a condition your strategy either matches or does not. A trend-following system with volatility-scaled sizing generally does better in high volatility. A tight-stop scalping system generally does worse, because its edge is measured in pips and volatility spends pips on spread and slippage.
How to Build a Forex Volatility Trading Strategy
Execution is one trade. Design is the written rule set you bring to every trade and the evidence that it works, and three things belong to that stage rather than to the chart.
Write the rules down before risking anything. A stop multiple decided in the moment is not a rule, and a regime filter that exists only in your head cannot be reviewed after a losing month. Every parameter in the execution sequence above — the ATR-to-spread threshold, the multiple, the account-risk percentage — belongs in a specification with one value, not a range you pick from while the trade is live.
Test across both regimes. Run the rules over at least one high-volatility and one low-volatility period. A strategy with results from a single regime has not been tested, it has been sampled, and the sample flatters whichever conditions happened to prevail.
Define the review in advance. Decide what evidence would justify changing a parameter — a minimum number of trades, a drawdown threshold — so that adjustments follow the record rather than the most recent loss.
How to Trade Forex Volatility Profitably
Measure first, decide second. Every sizing and stop decision should trace back to a number — ATR, ADR, realised volatility — rather than a habit or a round figure.
Match the instrument and the session to the strategy. A strategy needing 80 pips does not belong on a pair averaging 50, and an intraday strategy does not belong in the hours when your pair's book is thin.
Adapt size and stops together. When volatility rises, the stop widens and the position shrinks. One without the other is not risk management.
Respect execution costs. Spread and slippage are largest exactly when the opportunity looks biggest. Profitability is measured after both.
Never treat volatility as direction. ATR rising tells you the market is moving further, not which way. That is where most volatility strategies go wrong: they read a magnitude as a signal.
The traders who do well in volatile conditions are rarely the ones who predicted the volatility. They are the ones whose position sizes were already small enough that the move they did not predict did not matter.