


Fibonacci retracement is a drawing tool that splits a completed price move into horizontal levels at fixed percentages of that move — most commonly 23.6%, 38.2%, 50%, 61.8% and 78.6%. Traders anchor it to a swing low and a swing high and then watch those levels as candidate support or resistance while price pulls back against the trend. It answers one narrow question: if this move is going to correct before continuing, where might the correction stop?
What Is Fibonacci Retracement?
The tool takes its name from the Fibonacci sequence (1, 1, 2, 3, 5, 8, 13, 21, 34...), in which each number is the sum of the two before it. Divide any number in the sequence by the next one and the result converges on 0.618 — the ratio usually called phi or the golden ratio. Divide by the number two places along and you converge on 0.382. Take the square root of 0.618 and you get roughly 0.786. These three ratios, plus 0.236, are where the standard retracement levels come from.
What the mathematics does not supply is a reason why currency prices should respect them. There is no regulator, exchange rule or published study that makes 61.8% a turning point. The practical case for the tool is narrower and more honest: it produces a consistent, repeatable way to divide a swing, huge numbers of traders and platforms plot the same divisions, and orders therefore cluster around them. That makes the levels worth knowing about because other participants are watching them — not because the ratio has predictive power of its own.
Retracement is also strictly backward-looking. You cannot draw the tool until a swing has finished, which means every level you see is derived from price action that has already happened.
What Are the Main Fibonacci Retracement Levels?
- 23.6% — a very shallow correction. Reaching only this level and turning usually signals a strong, momentum-driven trend where buyers or sellers are unwilling to wait for a deeper discount.
- 38.2% — derived from dividing a Fibonacci number by the one two places ahead. A common first stopping point in trends that are still healthy.
- 50% — not a Fibonacci ratio at all. It is simply the midpoint of the swing, included by convention because half-retracements are watched widely and most platforms plot it by default.
- 61.8% — the golden ratio, and the level most often cited. A pullback this deep gives up most of the prior swing, so it tends to attract traders looking for a better entry price and those arguing the trend is failing.
- 78.6% — the square root of 0.618. Price this deep into the swing is close to invalidating the move entirely, which is why the level is usually treated as a last-chance area rather than a comfortable entry.
Treat each of these as a zone, not a line. Spreads, wicks and the fact that reasonable people pick slightly different swing points mean price rarely turns at an exact decimal.
How Does Fibonacci Retracement Work in Forex?
The mechanics are the same on every platform. You identify one completed impulsive swing, mark its start and end, and the software divides the vertical distance between them by the percentages above and draws a horizontal line at each. Everything in between is measured against that single swing.
That has a direct consequence: the tool is only as good as the swing you measure. Two traders looking at the same EUR/USD chart can place their anchors on different highs and produce Fibonacci grids that disagree by dozens of pips. This is why swing selection, not level selection, is the part of the process worth spending time on. Use the swing that a chart reader would point to unprompted — a clear low, a clear high, one continuous directional move between them, ideally visible on a higher timeframe as well.
How to Draw Fibonacci Retracement Correctly
On TradingView the tool is called Fib Retracement and works by connecting two extreme points; the platform supports up to 24 configurable levels, and TradingView's own documentation splits them into internal retracements (values between 0 and 1), external retracements (above 1) and extensions (below 0). In MetaTrader 5 the Fibonacci Retracement object ships with nine levels by default — 0.0, 23.6, 38.2, 50, 61.8, 100, 161.8, 261.8 and 423.6 — so the extension levels are already on the chart once you draw it.
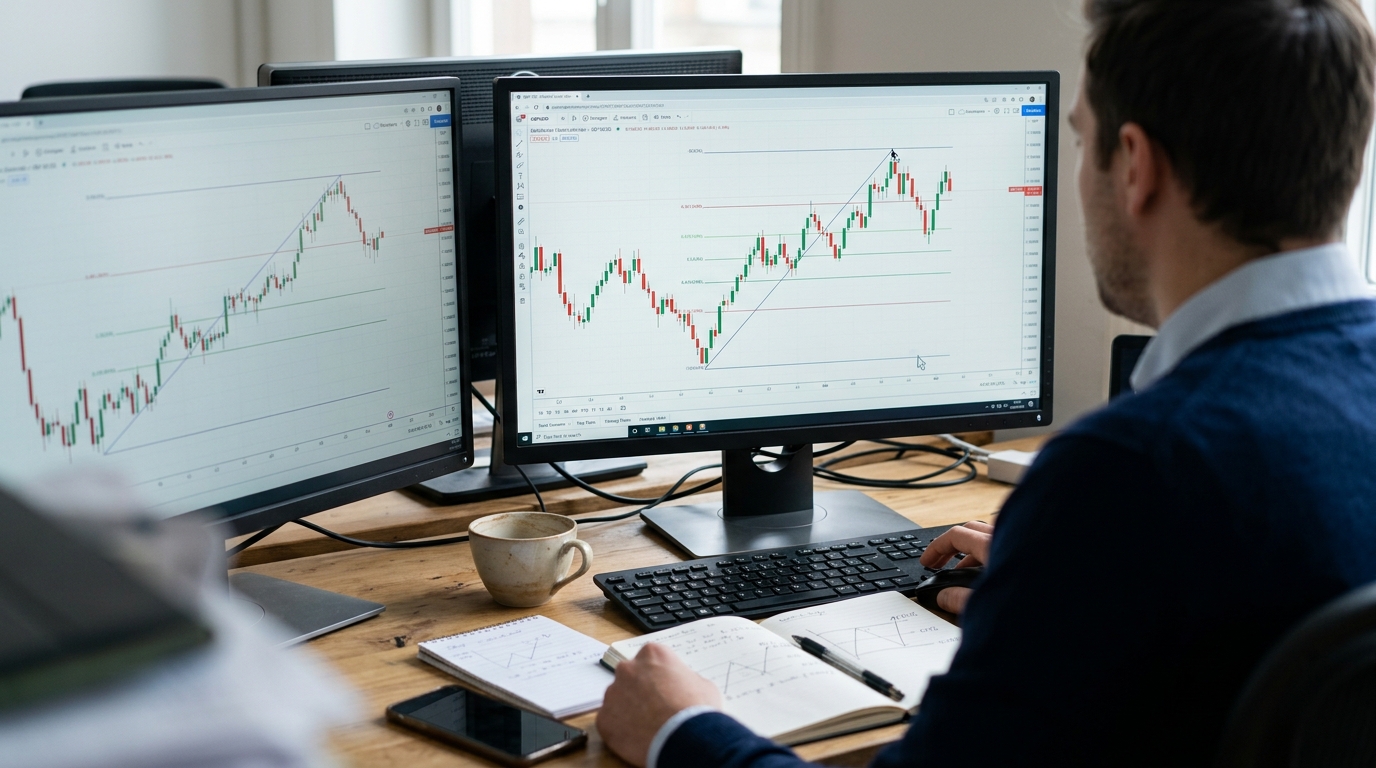
Whichever platform you use, the direction of the drag determines which side of the swing counts as 0% and which as 100%, so getting it the right way round matters more than any setting in the dialog.
Fibonacci Retracement in an Uptrend
Draw from the swing low to the swing high: the low is the 100% anchor and the high is 0%. The resulting levels sit below current price and are read as potential support. A pullback that holds around 38.2% suggests demand is still aggressive; one that only stabilises near 61.8% or 78.6% suggests buyers are far more price-sensitive, and a close beyond the original swing low means the swing you measured no longer describes the market.
Fibonacci Retracement in a Downtrend
Draw from the swing high to the swing low. The levels now sit above price and are read as potential resistance during a bearish pullback — the counter-trend rally that interrupts a decline. The interpretation mirrors the uptrend case: shallow rallies that stall near 23.6% or 38.2% indicate persistent selling pressure, while a rally through 78.6% has effectively retraced the whole leg.
How to Use Fibonacci Retracement for Forex Entries
The workable sequence is: establish the trend, wait for price to reach a level, then require something independent to confirm before you act. Arriving at 61.8% is not a buy signal; it is a place to start paying attention. Confirmation can come from market structure (a higher low forming at the level), candlestick behaviour (a rejection wick or engulfing candle), or an indicator you already trust. Entering on touch alone means you are trading a horizontal line you drew yourself.
Confluence improves the odds more than precision does. A 61.8% level that lands on a prior swing high, a round number and a moving average is a far more interesting area than a 61.8% level sitting alone in empty space. If nothing else lines up, the honest conclusion is often that there is no trade — see our wider Forex trading education library for the structural and price-action groundwork this depends on.
How to Use Fibonacci Retracement for Stop Loss
A stop belongs at the price that proves the idea wrong, not at the nearest convenient number. If you enter at 61.8% in an uptrend on the thesis that the pullback is over, the thesis fails when price makes a decisive move below the swing low that anchored the grid — or, more conservatively, below the next Fibonacci level down with a buffer for spread and volatility.
Avoid the temptation to stop out a few pips beyond the level itself. Fibonacci levels are exactly where wicks and stop hunts cluster, precisely because so many traders place stops there. If the resulting stop distance makes the position size uncomfortable, the correct response is to reduce size or skip the trade, not to tighten the stop into the noise. Volatility measures such as ATR are a more defensible way to size the buffer than eyeballing it.
How to Use Fibonacci Retracement for Take Profit
Targets normally come from three places. First, the prior swing extreme: in an uptrend, the swing high that anchored 0% is the obvious first objective. Second, Fibonacci extensions — the 127.2%, 161.8% and 261.8% projections beyond the original swing, which MetaTrader 5 plots by default. Third, nearby technical levels that have nothing to do with Fibonacci: previous highs and lows, session ranges, round numbers, and untested areas of consolidation.
Whichever you use, check the resulting reward against the stop distance before entering rather than after. A setup at 38.2% with a stop below the swing low often carries a poor ratio simply because the stop is far away and the target is close.
Fibonacci Retracement vs Fibonacci Extension
Retracement levels live inside the measured swing and describe how far a correction might travel. Extension levels live beyond it and project where a continuation might reach. Same ratios, different geometry: 61.8% retracement is a discount within the move, while 161.8% extension is a target past its end. Retracements are used to plan entries and stops; extensions are used to plan exits. Confusing the two is a common source of targets that were never realistic.
Best Fibonacci Levels for Forex Trading
In practice most attention goes to 38.2%, 50% and 61.8%. The reason is more about crowding than mathematics: those three levels are enabled by default on nearly every platform, they are the ones taught in nearly every course, and 50% has the additional pull of being a simple midpoint. Where many participants watch the same area, reaction at that area becomes more likely.
None of that makes any level a reversal point. A level is a place where a decision becomes cheaper to test, with a defined invalidation point close by. Plenty of strong trends slice through 61.8% without pausing, and plenty of ranges reverse nowhere near a Fibonacci line.
Fibonacci Retracement Trading Strategy
A workable strategy sequences six steps and refuses to skip any of them: identify the trend on a higher timeframe; pick one unambiguous impulsive swing within it; draw the retracement in the direction of that swing; wait for price to reach 38.2%–61.8%; require independent confirmation at the level; then define the stop beyond the swing extreme and the target at the prior extreme or an extension before entering.
Fibonacci + Price Action Strategy
Use the level to decide where to look and candles to decide whether to act. A long lower wick rejecting 61.8% in an uptrend, a bullish engulfing candle at 50%, or a higher low forming just above 38.2% all provide something observable. Structure matters as much as the individual candle: a pullback that holds above the previous higher low keeps the uptrend intact, while one that breaks it has changed the market's character regardless of which level it happened at.
Fibonacci + Moving Average Strategy
When a Fibonacci level coincides with a moving average many traders already treat as dynamic support — a 50 or 200 period average, for instance — you have two independent reasons for the same area. Used the other way round, the moving average is also a filter: if price is below a falling 200-period average, taking long entries at retracement levels means fighting the direction the filter describes.
Fibonacci + RSI Strategy
RSI adds a momentum reading to a location. A pullback into 61.8% in an uptrend that pushes RSI toward oversold, then turns up, is a more coherent picture than the same pullback with RSI still falling. Divergence is the more useful signal: price making a marginal new low into a Fibonacci level while RSI makes a higher low suggests the correction is losing force. RSI on its own says nothing about where to enter, which is the gap the level fills.
Fibonacci Retracement on MT4, MT5 and TradingView
- MetaTrader 4 — Insert → Fibonacci → Retracement, then click the first anchor and drag to the second. Levels and labels are edited by double-clicking the object and opening its Fibo Levels tab.
- MetaTrader 5 — the Fibonacci Retracement analytical object is drawn the same way: place a point, hold the mouse button and drag to set the length and slope. Its nine default levels run from 0.0 to 423.6, and entering
(%$)in a level's Description field makes the platform display that level's actual price alongside the percentage. - TradingView — pick Fib Retracement from the drawing toolbar and connect the two extremes. The settings dialog exposes up to 24 levels with individual visibility checkboxes, and you can right-click the drawing to add a price alert that fires when any active level is crossed.
All three snap to highs and lows when magnet mode is enabled, which is worth using: it removes one source of inconsistency in where you place the anchors.
Common Fibonacci Retracement Mistakes
- Choosing the wrong swing. Anchoring to a minor intraday wiggle instead of the dominant swing produces levels nobody else is watching.
- Redrawing until it fits. Moving the anchors until a level lines up with price you have already decided to trade is curve fitting, not analysis.
- Forcing the tool onto every chart. Retracement assumes a trend that is correcting. In a range there is no impulsive swing to measure.
- Trading the touch. Entering because price reached a level, with no confirmation and no reason for the level to hold.
- Ignoring structure. A level below a broken higher low is not support just because it is a Fibonacci level.
- Using it as a standalone system. Retracement locates areas. It does not supply direction, timing or risk control.
Does Fibonacci Retracement Actually Work in Forex?
It works as an organising framework and not as a predictor. Drawn consistently, it gives you defined areas to watch, a clear invalidation point for each idea, and a common reference shared with a large part of the market — which is genuine value when the alternative is entering pullbacks at arbitrary prices. What it does not do is forecast reversals. The ratios have no mechanism behind them in currency markets, the levels shift with the swing you choose, and the same tool applied to the same chart by two traders can produce different conclusions. Anyone presenting Fibonacci levels as reliable turning points is overstating what the tool is.
How to Use Fibonacci Retracement More Effectively
The practical workflow is short. Establish the trend on a timeframe above the one you trade. Select one swing that is obvious rather than convenient, and leave the anchors where you put them. Mark 38.2%, 50% and 61.8% and treat each as a zone. Wait for price to arrive and for something independent to confirm — structure, a candle, an indicator. Define the stop beyond the swing extreme, size the position from that distance, and set the target from the prior extreme or an extension. If nothing lines up, do not trade, and never move the anchors to manufacture a setup that the chart did not offer. Combining that discipline with sound risk management habits matters far more to the outcome than which decimal you entered at.