In a trader's life, there is a defining moment when things change forever. That moment typically happens when they first open a Forex account, and looking at the chart brings all sorts of ideas to mind. The moving lines on the screen, the various colored candles, the numbers that constantly change from moment to moment, and the prices that seem to go up and down every second are enough to make someone question their sanity. For most individuals just getting into trading, seeing Forex for the first time can feel so overwhelming that they may want to walk away and never look back.
The reality is that once you learn to read Forex charts, you will understand how charts tell a story about the market. They will show you how the price has gone up and down in the past, where traders have made trades in the past, and where you could potentially find an opportunity in the future. Rather than trying to guess where the market is headed and option numbers based on the sound of your gut, traders will have the ability to use the chart to help make decisions based on price movements.
As a beginner, learning how to read Forex charts is a key skill that every trader must develop. Regardless of whether you plan on trading short-term or holding for many days, learning how to read charts will help you identify trends, find support and resistance, and better manage your overall risk, which is a key principle in Risk Management for Retail Traders.
This guide is for beginner traders to learn how to read Forex charts, review the types of charts used by traders, and understand the basics of chart reading to locate support and resistance levels, identify trends, and forecast price action across different pairs.
What Is The Forex Chart?
A Forex chart is a graphical representation of the price movement of a currency pair over a specified time period. Forex charts visually show how the exchange rate between two currencies changes as investors buy and sell them. For example, looking at EUR/USD, you can see how the euro has performed against the US dollar over time.
When reviewing a Forex chart, two things can be understood: the price of currency (vertical axis) and time (horizontal axis), which becomes even clearer when you understand What Is a Pip in Forex.
Over time, new prices will be updated on the chart. This will allow traders to see patterns, trends, and projected behaviors of future markets.
To analyze the future market, multiple charts have been created. These charts use different timeframes to view the price of a currency pair or an index; for example, you may have charts showing price movements over the last 1 minute to the last 3 months.
Types of Forex Charts
With numerous chart types available for trading, there are also many ways to display prices visually.
The Line Chart
The simplest of all chart types is the Line chart, which links the closing price of one period to another, forming a continuous line over time. It is useful for providing a quick overview of the market's direction over time, but it can offer a limited indication of price movement compared to other chart types.
The Bar Chart
The Bar chart provides a more in-depth view of price movement over time. Each individual bar provides 4 price values:
- Open Price
- High Price
- Low Price
- Close Price
With these additional values, a trader can gain a better understanding of the way the price moved during a particular timeframe.
The Candlestick Chart
Among traders, the most widely used type of forex chart is the candlestick chart. Candlestick charts display the four key price components (Open, High, Low, and Close), similar to a bar chart. The candlestick chart format provides for a much more visual representation of price activity. The candlestick shows the Open, Close, High, and Low for a specified time period and is most commonly colour-coded to indicate the direction of price movement.
Forex Chart Types Comparison
Chart Type | Information Displayed | Best For |
Line Chart | Closing price only | Identifying overall trends |
Bar Chart | Open, High, Low, Close | Detailed price analysis |
Candlestick Chart | Open, High, Low, Close with visual body | Technical analysis and patterns |
This comparison highlights why candlestick charts are the most widely used format in modern trading.
Understanding Timeframes in Forex Charts
The timeframe is an indication of how much time each price bar (or candle) will last, and for example:
• For a 1-minute chart, the candle will represent one minute of trading
• For a 15-minute chart, it represents a 15-minute period of time
• For a 1-hour chart, it shows that it represents one hour of trading
• For a daily chart, it indicates that the candle has lasted an entire day
Short-term traders tend to trade in smaller timeframes—like the 1-minute and 5-minute charts—whereas long-term traders prefer the 1-hour or daily charts, often influenced by Forex Trading Sessions Explained.
The timeframe you select for trading is based on your trading strategy and how often you plan to trade.
How to Identify Trends on Forex Charts
You can analyze charts by starting with the price trend (direction of price) to guide your trade decision.
There are three types of price trend:
Price Uptrend
The price moves higher consistently, creating higher highs and higher lows.
Price Downtrend
The price decreases continuously over time, forming lower highs and lower lows.
Price Sideways Movement (or Ranging)
Sometimes, the price of an instrument does not follow a clear upward or downward trend. Instead, it moves within a range over time. Traders describe this as price moving sideways or ranging.
By identifying the trend, the trader will know which type of order to place (buy/sell) and when to place it.
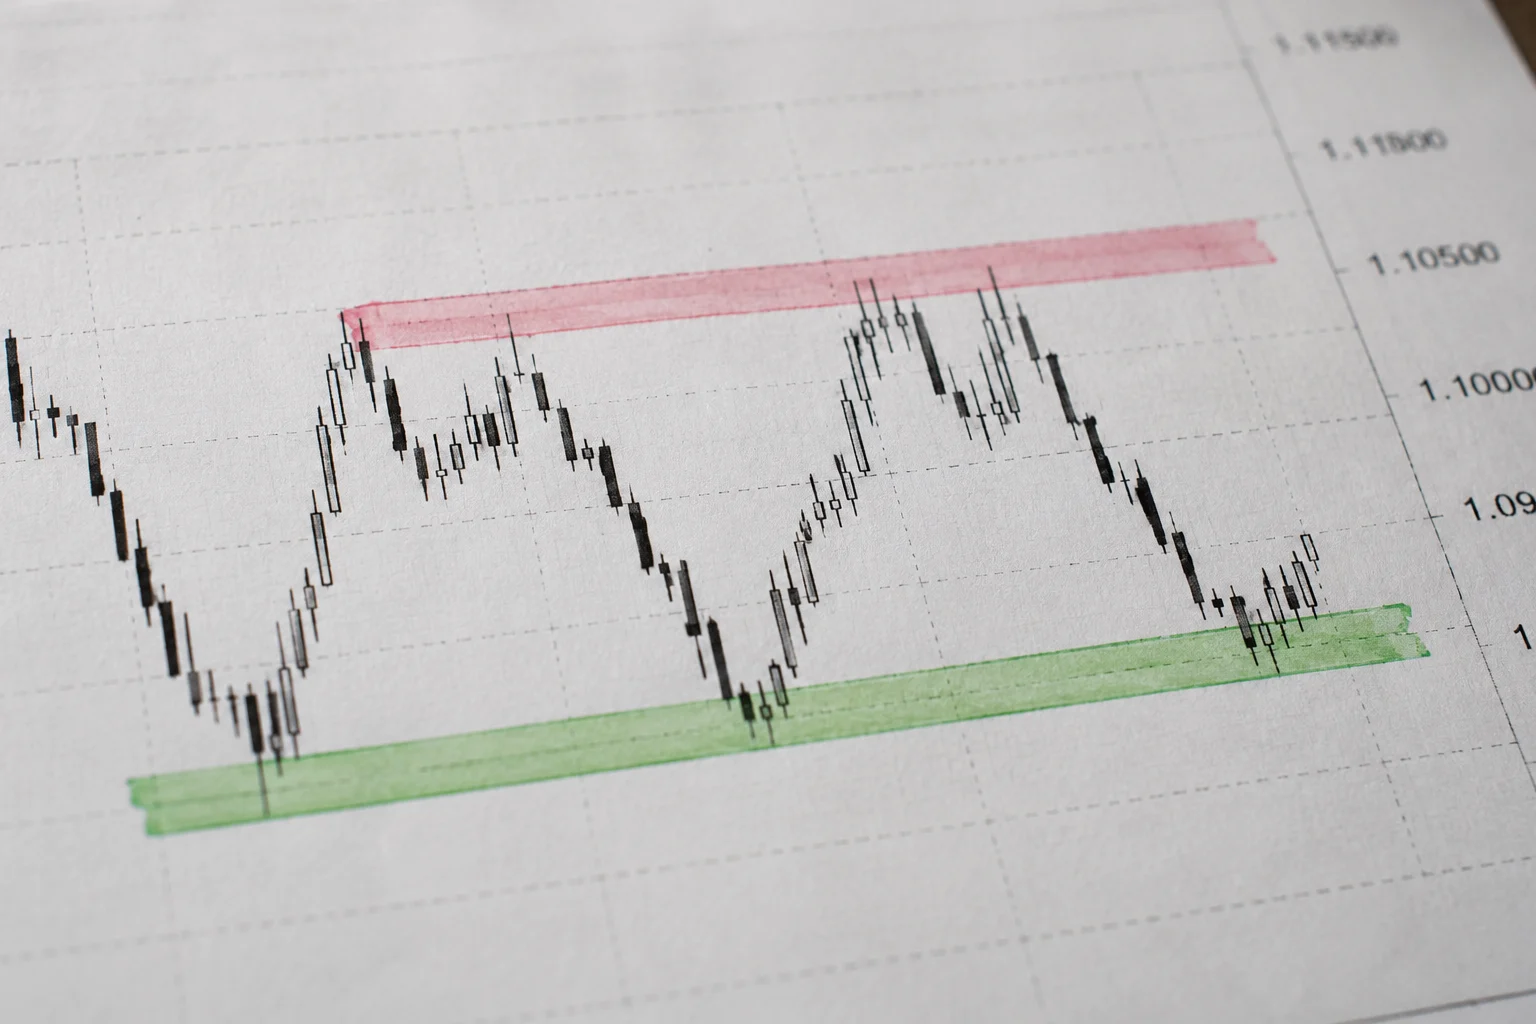
Understanding and Using Price Support & Resistance Levels
Price support and resistance are other important characteristics to understand when analyzing a forex chart.
A support level is a price point at which the market stops falling and has the potential to resume rising, creating an opportunity for buyers to enter the forex market.
A resistance level indicates an area where the price is likely to stop rising (but may still decline).
As traders generally use them as decision points for entering or exiting positions, both support and resistance levels are important to understand.
Basic Candlestick Patterns Beginners Should Know
Candlestick patterns help traders understand market sentiment.
Some common patterns include:
Doji – Shows market indecision where buyers and sellers balance each other.
Hammer – Often signals a potential reversal after the market moves down.
Engulfing Pattern – Reveals strong buying or selling pressure, depending on the direction.
Never use patterns alone for trading decisions, but combine them with other analysis tools to gain useful insight.
Using Indicators with Forex Charts
Many traders use technical indicators to analyze charts more effectively.
Some commonly used indicators include:
• Moving Averages – Help identify the overall trend
• Relative Strength Index (RSI) – Measures whether a market is overbought or oversold
• MACD – Helps identify momentum and trend changes
Indicators are tools that support decision-making, but they should not replace understanding price behavior.
Common Mistakes Beginners Make When Reading Charts
Many new traders make mistakes when analyzing forex charts for the first time.
One common mistake is overloading charts with too many indicators. This can create confusion rather than clarity.
Some beginners focus on very small timeframes without grasping the bigger picture. Higher timeframes often provide more reliable signals.
Many beginners chase price movements rather than wait for clear setups.
Practice patience and discipline to match your chart analysis skills.
Tips for Improving Chart Reading Skills
Improving chart-reading skills takes time and practice. Study historical charts to recognize patterns and understand how markets behave by looking at past price movements.
Using a demo account is another helpful method. Traders can practice analyzing charts and placing trades without risking real money. Keep a trading journal to track your decisions and find areas for improvement.
Conclusion
Learning to read forex charts is one of the most important steps in becoming a successful trader. Charts provide valuable insight into market behavior, helping traders identify trends, key price levels, and potential trading opportunities.
Remember, while learning chart reading can seem difficult, its fundamental concepts become clear with practice. Focus on understanding the basics to simplify the process, using reliable sources like Your Trusted Broker Resource to support your learning journey.
Key point: By observing price movement, spotting trends, and understanding support, resistance, and simple patterns, beginners can build a strong foundation in technical analysis.
With experience and practice, chart reading becomes natural. Stay patient, keep learning, and approach trading with discipline and realistic expectations.